
04 / Widgets · Activity Map
Activity Map
The strikes daily closes kept landing near over recent sessions, with the dealer exposure and today's trading at each one.
Activity Map starts from price, not from options: it counts how many recent daily closes landed near each strike (a visit), keeps the strikes price actually spent time at, and shows what sits there. Every value is weighted by the number of visits, so strikes price keeps returning to stand out.
| Column | What it shows |
|---|---|
| P/A | Whether gamma, delta, vanna and charm agree at the strike: positive when they all lean long, negative when they all lean short |
| GAMMA, DELTA, VANNA, CHARM | Each exposure at the strike, relative to the largest shown |
| V/OI VS MED | Today's volume against open interest at the strike, compared with the median of the strikes shown |
In Details choose the lookback (7, 14 or 30 sessions), the proximity a close must come within to count (10, 25 or 50 basis points), the expiries and how many strikes to show. Details also names the busiest strike.
Practical application#
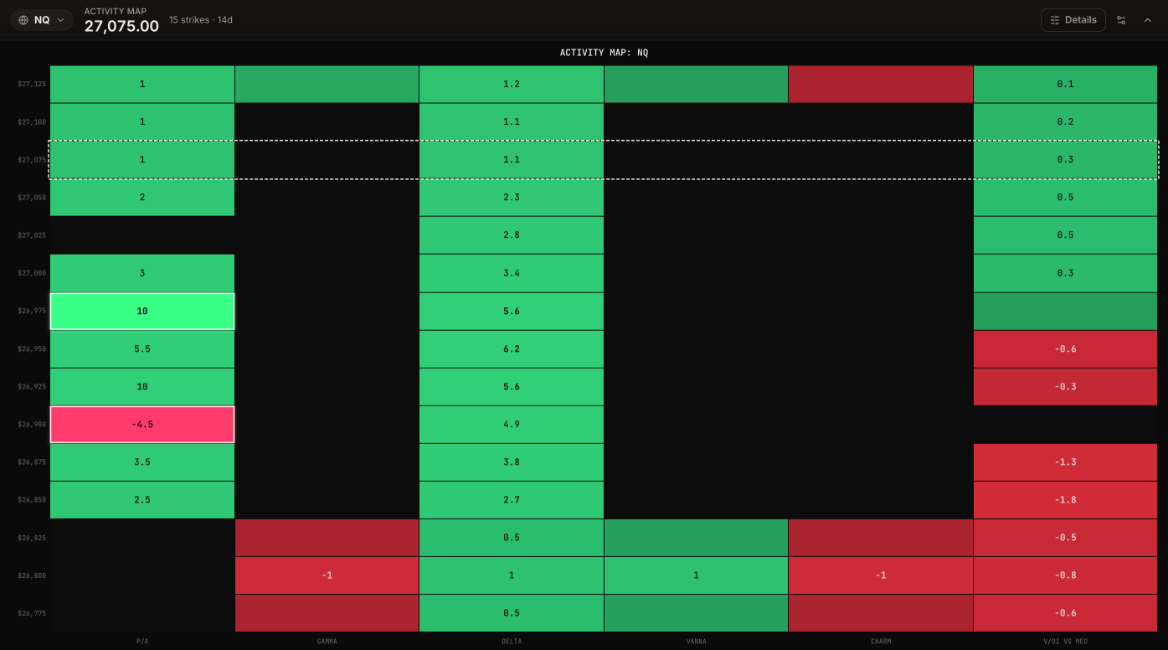
Reading it. Over the last 14 sessions, closes landed within 25bp of 15 different strikes, from 26,775 to 27,125. The busiest is 26,950, with 11 of 14 closes nearby. The P/A column is brightest at 26,975 (+10): all four exposures lean the same way at a strike price visited 10 times. One strike breaks the pattern: 26,900 at -4.5, where the exposures lean short. In the last column, the strikes near today's 27,075 trade above the median, while 26,850 to 26,875 trade well below it.
What it means. For two weeks NQ has settled around 26,950 to 26,975, and the positioning there is aligned. 26,900, just below, is where that support gives way to exposure leaning the other way.
How to use it.
- The busiest strikes are where the market has been accepting price. Moves away from them often come back; use them as targets for fades.
- Strong positive P/A at a busy strike: a sturdier level. Negative P/A: a level more likely to give way.
- High V/OI vs median at a strike: today's trading there is unusually heavy for the positions already open; something is changing at that level.
- Use the 30-session lookback for the bigger picture and 7 for the latest range.
Open interest in a grid of strikes by expiries, to find where positions are concentrated.
One greek's dealer exposure in a grid of strikes by expiries, so you can see which expiry holds the weight.
Today's likely range projected from the prior close using how far the market has really moved.