
04 / Widgets · Tape
Tape
Candles with the gamma profile drawn beside price, the regime and the wall nearest the action.
The Tape widget puts the session's candles and the gamma profile in one view: price on the left, the dealer gamma at each strike drawn as horizontal bars at the same price scale. The header shows the regime (LONG Γ or SHORT Γ), when the data last updated and the spot price. The call wall, put wall, flip and vol trigger are drawn across the whole chart.
What it shows#
| Element | What it is |
|---|---|
| Candles | The session, in 5-minute bars |
| Gamma profile (bars) | Dealer gamma per strike: green long, red and orange short |
| CALL WALL / PUT WALL | The largest call and put gamma strikes |
| FLIP | Where dealer gamma changes sign |
| VOL TRIGGER | The line under which volatility tends to expand |
| SPOT | The current price |
In Details you can switch the profile to delta, vanna or charm, or to the session's traded options profile instead of open positioning.
Practical application#
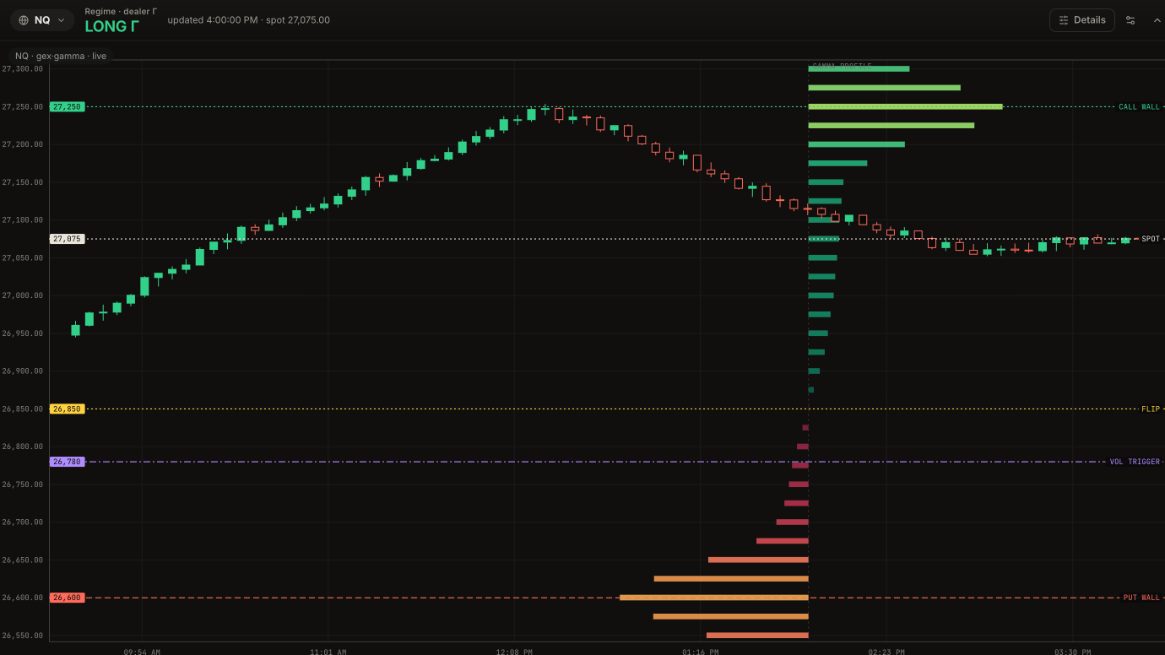
Reading it. The regime reads LONG Γ: price is well above the flip at 26,850. From the open, NQ climbs steadily from about 26,950 straight into the call wall at 27,250, the biggest green bar in the profile. It touches it around 12:20 PM, cannot hold above it, and drifts back down through the afternoon to settle at 27,075. Everything between price and the flip is green: long gamma all the way down.
What it means. In long gamma, dealer hedging leans against moves, and the largest bar is where that is strongest. The rally ran out of room at exactly the strike the profile said it would.
How to use it.
- Price approaching the biggest green bar in LONG Γ: expect it to slow and stall there. Take profits on longs, or look for a fade with a stop just beyond the wall.
- Green bars below price: pullbacks are likely to be bought on the way to the flip.
- Red bars below price in SHORT Γ: nothing in the profile is likely to cushion a drop; give moves more room.
- A wall price has just broken back under: often acts as resistance on the next bounce.
Candlesticks with the walls, gamma flip, vol trigger and 1σ band drawn on price, and how to trade them.
Net dealer gamma at every strike, with the walls, flip, vol trigger and 1D range marked, and how to read it.
What positive and negative gamma mean for price, and how to read the regime badge.