
04 / Widgets · Put/Call Parity
Put/Call Parity
How far each call and put pair strays from put/call parity, strike by strike, to spot pricing dislocations.
Calls and puts on the same strike and expiry should price consistently with each other: that relationship is put/call parity. The Put/Call Parity widget plots how far each pair strays from it, in dollars, at every strike. Dots near zero are fairly priced; dots far from zero are dislocations. Green dots are pairs where the call is priced above what its put implies, red dots the reverse. The header gives the average absolute deviation and how many pairs were checked.
Practical application#
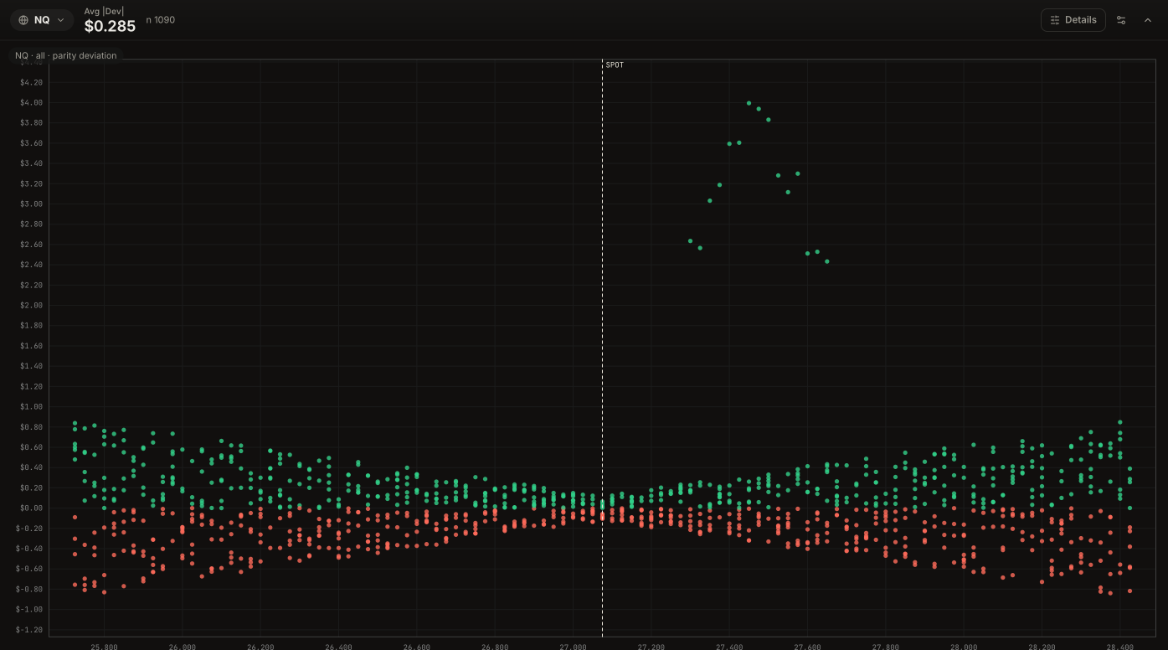
Reading it. Across 1,090 pairs the average deviation is $0.285. Near spot the dots sit within a few cents of zero, and they spread out to about ±$0.80 on the far strikes, where quotes are wider. One group does not fit: about a dozen green dots between 27,300 and 27,650, sitting $2.40 to $4.00 above zero. Picking expiries one at a time in Details shows they all belong to the expiry four days out.
What it means. In that one expiry, upside calls are priced well above what the matching puts imply. Someone is paying up for those calls, or the quotes there are stale or wide.
How to use it.
- A tight band around spot: the chain is priced consistently there; quotes can be trusted.
- A cluster away from zero in one expiry: treat prices there with care. If you trade those strikes, use limit orders, and compare with the same strikes in the next expiry.
- Calls rich at upside strikes: demand for upside in that expiry. Check Unusual Activity and Open Interest to see if new positions are behind it.
- Wide scatter on far strikes only is normal and mostly reflects wider quotes.