
04 / Widgets · GEX Levels
GEX Levels
Net dealer gamma at every strike, with the walls, flip, vol trigger and 1D range marked, and how to read it.
The GEX Levels widget shows net dealer gamma at every strike near price as horizontal bars, with the key levels drawn across them. Green bars are strikes where dealers are long gamma, red bars where they are short. The longest bars are the strikes that matter most.
What it shows#
| Element | What it is |
|---|---|
| Left pane | The day-trade expiry (0DTE when today has one) |
| Right pane | All expirations together |
| Green / red bars | Net dealer gamma per strike, in dollars per 1% move |
| CALL WALL / PUT WALL | The strongest call and put strikes, highlighted |
| FLIP | Where net gamma changes sign |
| VOL TRIGGER | The HVL: the same turning point across the whole book |
| 1D MAX / 1D MIN | The projected day range |
| SPOT | The current price |
Use Details to change the weighting (blend, open interest or volume), the strike bin and how many ranked levels are listed. Hover a bar to see its call and put split and the open interest behind it.
Practical application#
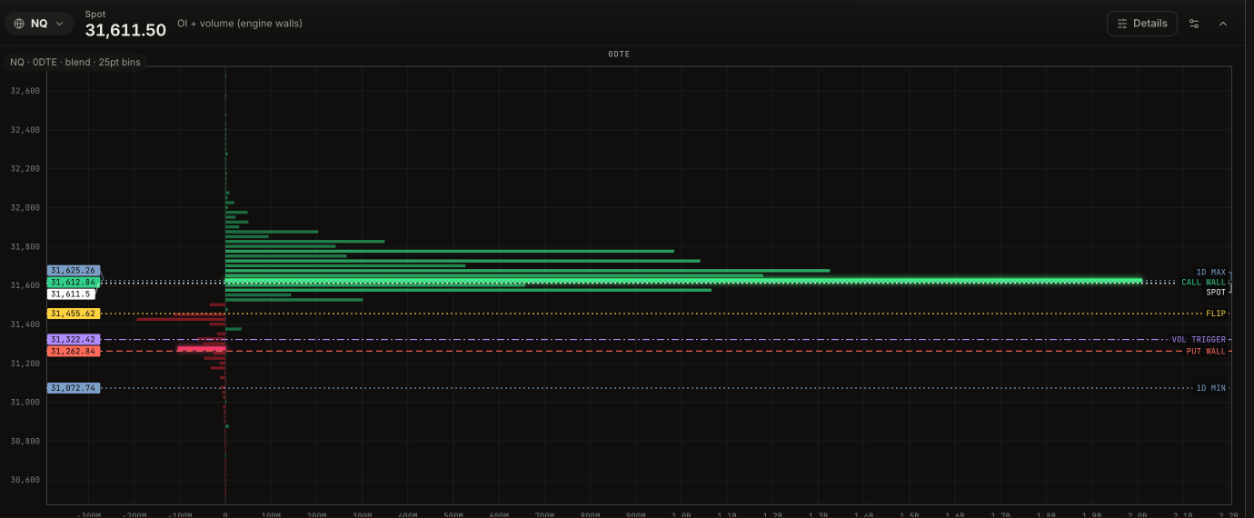
Reading the ladder. At 11:15 ET on Oct 6, NQ trades at 31,611.50, a point below the call wall at 31,612.84. That wall's green bar, about 2 billion, is far larger than any other strike, and the 1D max (31,625.26) sits just above it. Below price the ladder stays green down to the flip at 31,455.62; only small red bars sit near the put wall at 31,262.84.
What happened next. Price could not get through. It peaked at 31,616.75 and sold back to the flip by mid-afternoon. The walk-through is in the Candles guide.
What to do with it.
- One dominant bar right at price is the clearest fade setup the ladder shows: in positive gamma, hedging sells into it.
- Check what sits just beyond. Here the 1D max was only 13 points above the wall: little room for a breakout.
- Use the flip as the target and the invalidation line. A fade from 31,612 aims back toward 31,455; a close above the wall cancels it.
In Replay#
In Replay the widget shows the day-trade ladder as it was stored for that session, as net bars; choose the day-trade expiry in Details. The all-expirations view is not stored for past sessions.
Questions#
What do green and red bars mean in GEX Levels?#
Green bars are strikes where dealers are net long gamma, red bars where they are net short. The longest bars mark the strikes with the most hedging behind them.
What is the difference between the two panes?#
The left pane is the day-trade expiry; the right pane adds up every expiration. A wall that shows in both is stronger.
What call and put walls are, why price stalls at them, and when they break.
The price where dealer gamma turns from positive to negative, and why it matters.
The session's price against the call wall, put wall, gamma flip and vol trigger, with the nearest level called out.