
04 / Widgets · Net Drift
Net Drift
Cumulative call and put premium through the session, the net between them, and the underlying, so you can see which side is leaning.
Net Drift tracks the session's call premium and put premium as two running totals, with the net (calls minus puts) and the underlying on the same chart. A volume subchart below it shows net contracts the same way. It answers one question: which side is the options market leaning on today, and is that lean growing?
What it shows#
| Element | What it is |
|---|---|
| Calls (green) | Running call premium for the session |
| Puts (red) | Running put premium for the session |
| Net (green above zero, red below) | Calls minus puts |
| Underlying (blue, right axis) | The price over the same minutes |
| Net volume (subchart) | Call contracts minus put contracts |
In Details you can choose the expiries (0DTE, 1DTE or up to 90 days), the bucket size, moneyness, and filters that leave out very large trades or low-delta contracts. Click the chart to list the trades inside that bucket. Signed flow counts premium bought as positive and sold as negative, so a line can go below zero; Gross flow shows total activity only.
Marked (Beta) in the widget picker: it is newer, and some of the options data behind it can lag the live market by several minutes.
Practical application#
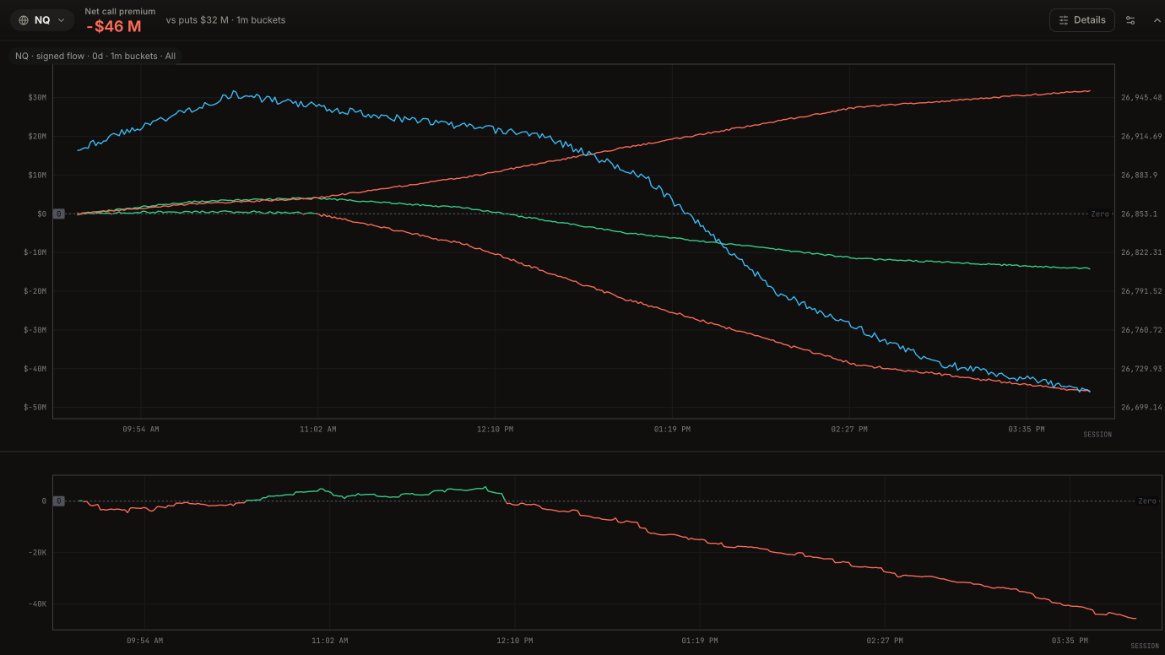
Reading it. In this example calls and puts trade evenly for the first hour, and net peaks at only $756K at 10:27 AM ET. From about 11:00 the lines split: put premium keeps climbing to $32M while call premium turns negative and ends at -$14M, so the net line falls through zero and keeps widening to -$46M. Price holds near 26,930 through lunch, then breaks lower after 1 PM and closes the session at 26,712. Net volume tells the same story at -46K contracts.
What it means. Traders were buying puts and selling calls for two hours before price moved. A net line that widens steadily, rather than in one spike, is a lean that is building, not a single hedge.
How to use it.
- Net falling while price is flat: pressure is building against the current level. Be careful buying dips, and watch the nearest support.
- Net and price moving together: the flow confirms the move; trends are more likely to continue.
- Net reversing while price keeps going: the move is losing its support; tighten stops.
- One large jump, then flat: check the trades in that bucket. A single big trade can be a hedge, not a view. The trade-size filter takes it out.
Read Net Drift for direction and change, not as a total of all premium traded that day. It is not available in Replay.