
04 / Widgets · Gamma Flip
Gamma Flip
The gamma flip, walls, vol trigger and max pain for each upcoming expiry, against the current price.
The Gamma Flip widget plots the flip for every upcoming expiry as a line, with each expiry's call wall, put wall, gamma wall and max pain as dots. It answers a question the single day-trade flip cannot: does the positioning behind today's regime continue into the next expiries, or is it only today?
What it shows#
| Element | What it is |
|---|---|
| Flip (yellow line) | Where gamma changes sign, per expiry |
| Vol Trigger (purple line) | The HVL per expiry |
| Call Wall / Put Wall (dots) | Each expiry's strongest call and put strike |
| Gamma Wall (orange dots) | Each expiry's largest gamma strike |
| Max Pain (dots) | Where each expiry's options pay out the least |
| Spot (dashed) | The current price |
Pick how far out to look with dte in Details (7 to 90 days, or all).
Practical application#
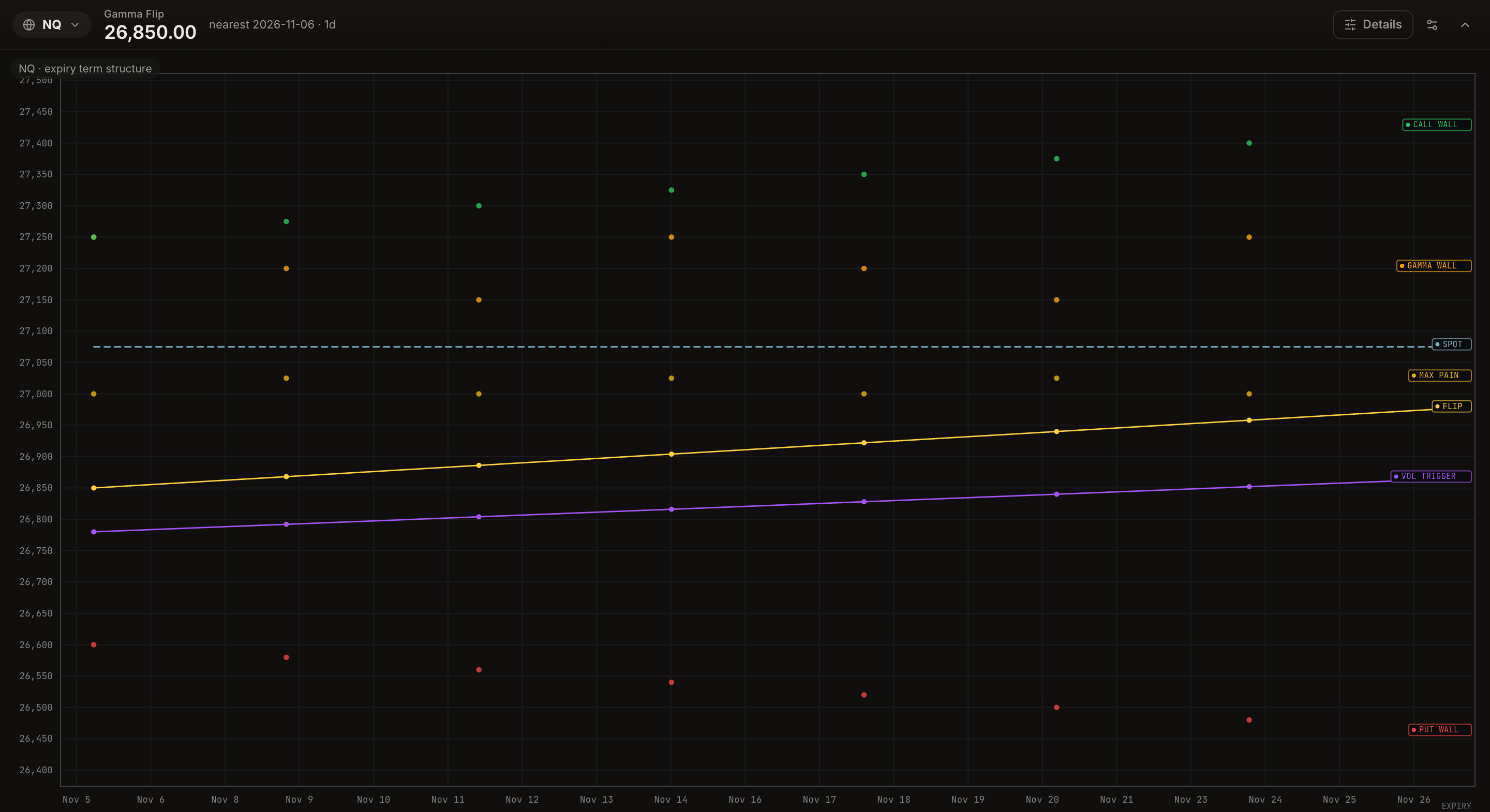
Reading it. In this example the nearest expiry's flip is 26,850 and the flips rise slowly to about 26,975 three weeks out. Spot, at 27,075, is above every one of them. The put walls step lower with each expiry and the call walls step higher.
What it means. Positive gamma is not just a feature of today's options: the whole curve agrees. That makes range behavior more durable, and a single bad headline less likely to flip the regime.
How to use it.
- All flips below price: positive gamma across the curve. Favor ranges and fades.
- Flips above price for the next expiries: today's regime may not last; be quicker to respect breakouts.
- Max pain dots clustered near spot (about 27,000 here) add a pull toward that area into each expiry.
This widget is not available in Replay: only the day-trade flip is stored over time, not every expiry's.