
04 / Widgets · Expected Move
Expected Move
The options-implied range around price for every horizon, with today's 1D band and how much of it is used.
Expected Move draws the range options imply around the current price for each number of days ahead, as a cone that widens with time. Today's band is marked as 1D MAX and 1D MIN, with the session's high and low beside it. The header shows the one-day move in points and percent, and how much of it the session has already used.
Practical application#
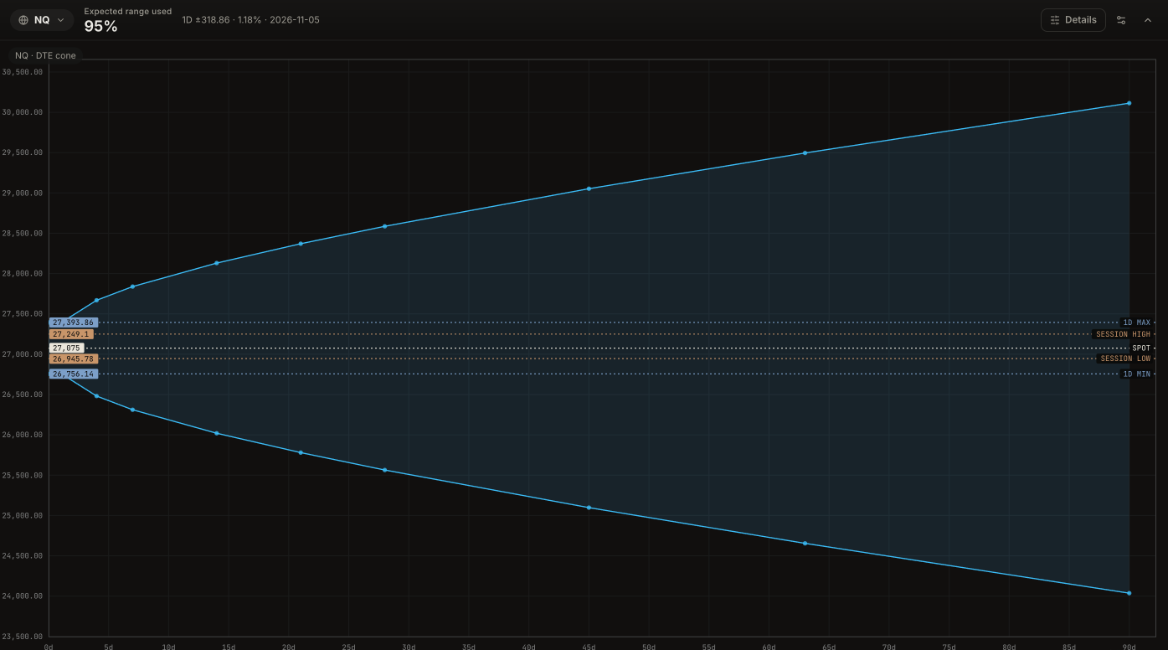
Reading it. Options price a one-day move of ±318.86 points (1.18%), a band from 26,756.14 to 27,393.86. The session has already traded from 26,945.78 up to 27,249.1, about 303 points, so the header reads 95% used. Further out, the cone widens to about ±594 points for the expiry four days away and ±764 for the one a week away.
What it means. Most of the move options priced for today has already happened. Extending the range much further would take news or a regime change, not ordinary flow.
How to use it.
- High percentage used late in the session: fade moves toward the session extremes rather than chasing breakouts; targets beyond 1D MAX or 1D MIN are less likely without a catalyst.
- Low percentage used early: there is room left; a trend day is still possible.
- Price outside 1D MAX or 1D MIN: a bigger-than-typical day. The band is one standard deviation, so roughly one session in three ends outside it; respect the move, and size down.
- Use the wider cone points to set swing targets and stops for trades held past today.
The range options are pricing for the session, and how to use the 1σ band.
Today's likely range projected from the prior close using how far the market has really moved.
At-the-money implied volatility for every expiry, with the 30-day VIX window marked.