
04 / Widgets · HV Projection
HV Projection
Today's likely range projected from the prior close using how far the market has really moved.
HV Projection projects today's likely range from the prior close, using how far the market has actually moved over recent sessions. It draws:
| Line | What it marks |
|---|---|
| VNZ (Volatility Neutral Zone) | Centered on the prior close: inside it, the day hasn't really moved yet |
| Bull avg / Bear avg | The average up and down day, projected from the close |
| Bull max / Bear max | The largest up and down day in the sample |
| Ceiling / Floor | Historical bounds most days stay inside |
| IV wall up / down | The close plus or minus what options imply for today |
The header shows today's change from the prior close. Choose how many sessions to learn from (60, 120 or 252) under lookback in Details.
Practical application#
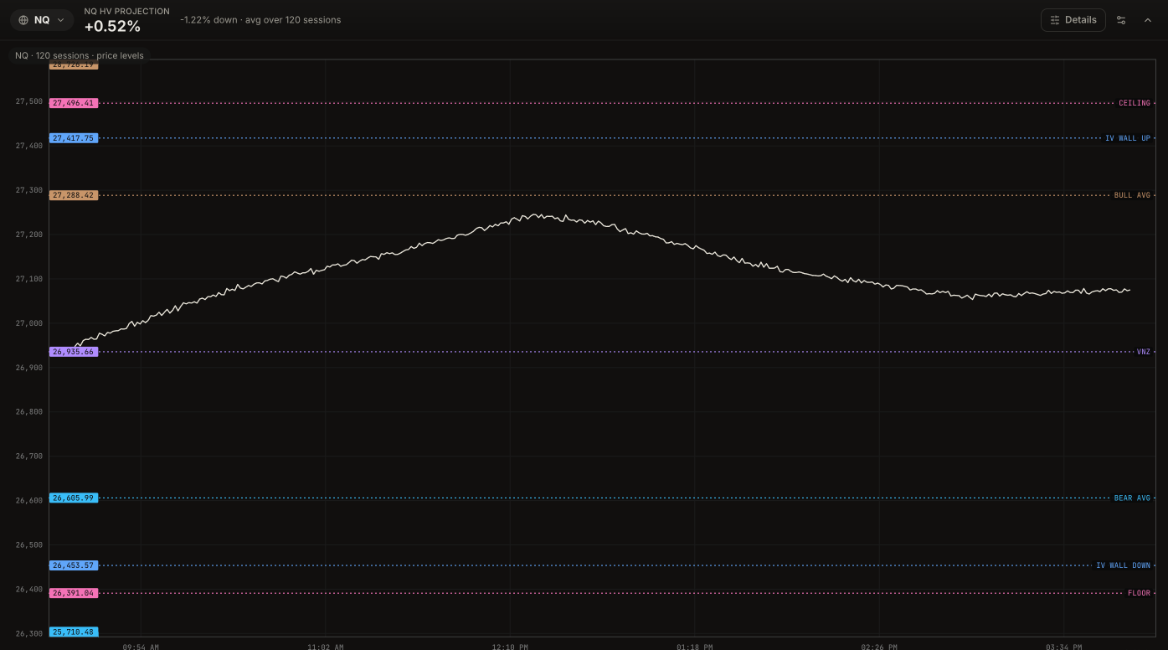
Reading it. NQ closed yesterday at 26,935.66, the center of the VNZ. Today it leaves the zone (26,841 to 27,030) by mid-morning and climbs to about 27,245 by early afternoon, then fades to close +0.52%. It never reaches the bull average at 27,288.42: an average up day over the last 120 sessions is +1.31%. The IV wall up (27,417.75) and the ceiling (27,496.41) are further above. On the downside, the average down day would have reached 26,605.99.
What it means. By the standards of recent sessions, this was an ordinary up day, and the high stalled before the first projected level. Nothing about the range was stretched.
How to use it.
- Price inside the VNZ: the day hasn't chosen a direction; breakout trades out of the zone have room to the averages.
- Price near Bull avg or Bear avg: the typical day's move is done. Take partial profits, and be careful adding.
- Price beyond the IV wall or the ceiling/floor: a rare day. Respect the trend, but expect sharp pullbacks.
- Use the 252-session lookback for a calmer, long-run picture, or 60 to reflect only the latest regime.
Realized volatility at each horizon against its historical range, with today's implied volatility on top.
The options-implied range around price for every horizon, with today's 1D band and how much of it is used.
The range options are pricing for the session, and how to use the 1σ band.