
04 / Widgets · Open Interest
Open Interest
Call and put open interest at every strike, the put/call ratio near spot, max pain and the key levels.
Open Interest shows how many contracts are open at each strike, calls to the right and puts to the left, colored by days to expiry. The header gives total open interest and the put/call ratio within ±2.5% of spot. Details adds the change since an earlier snapshot (delta tf: 15 minutes to a week, or the session), the largest call and put strikes, and the dealer levels. Hover a strike to see its own change.
Practical application#
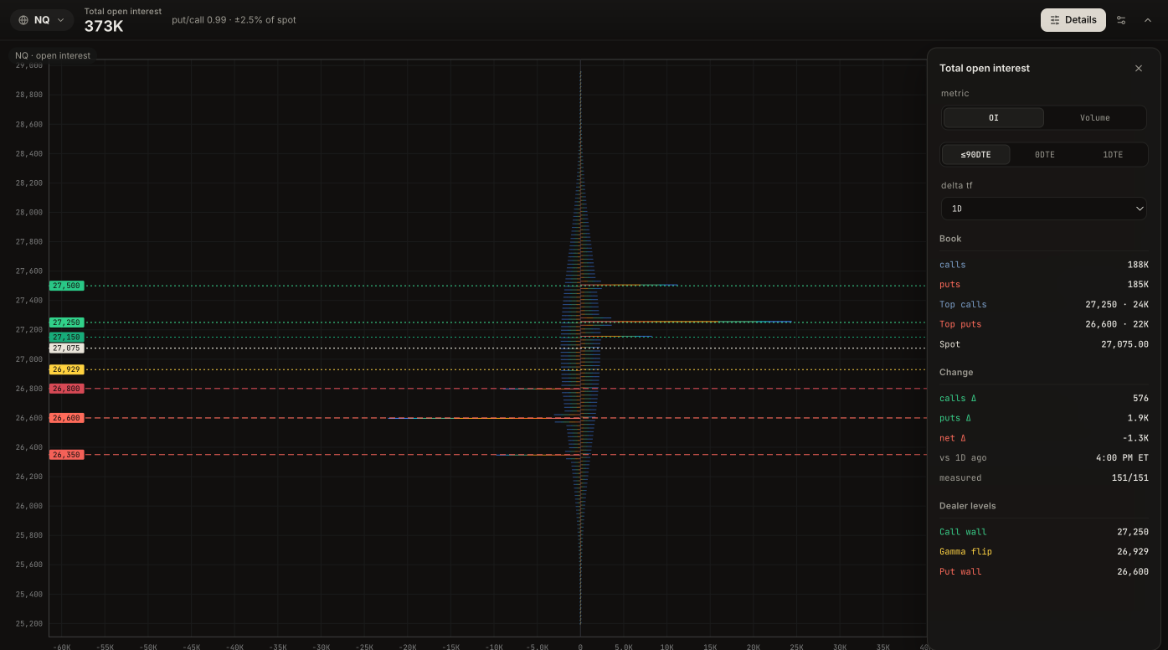
Reading it. The book is balanced overall: 188K calls against 185K puts. The biggest strikes are 27,250 for calls (24K contracts) and 26,600 for puts (22K). With delta tf set to 1D, the change tells the story of the last day: puts grew by 1.9K, most of it at 26,600 (about +1,450), while calls grew by only 576. Hovering 27,250 shows calls there fell by about 650, and 27,500 gained about 820.
What it means. Traders added protection at the put wall and rolled some calls from 27,250 up to 27,500. The floor got stronger; the ceiling moved up and got a little thinner.
How to use it.
- OI building at a put strike under price: a level the market is protecting. Above the gamma flip it is more likely to hold on the first test; below the flip it can break more easily.
- OI falling at the call wall: the ceiling is weaker than yesterday. A break above it is more likely to run toward the next strike with new OI.
- Use 15m or 1h during the day to catch positions opening while you watch; use 1D before the open to see what changed overnight.
- Pair it with Greek Exposure to see how much those contracts matter to dealer hedging.
The strike where expiring options pay out the least, and how much weight to give it.
The day's price with dealer exposure by strike for the whole chain, and every wall, flip and vol trigger.
Dealer exposure for any greek at every strike, colored by days to expiry, with the walls, flip and max pain.