
04 / Widgets · Chain Profile
Chain Profile
Net gamma of the whole chain at each strike, as one profile, with the flip, call wall and put wall.
Chain Profile collapses every expiry in the window (90 days by default) into one bar per strike, so you see the shape of the whole chain at a glance. The header shows the net chain gamma and the flip. Green bars are strikes where dealers are long gamma, red where they are short.
Practical application#
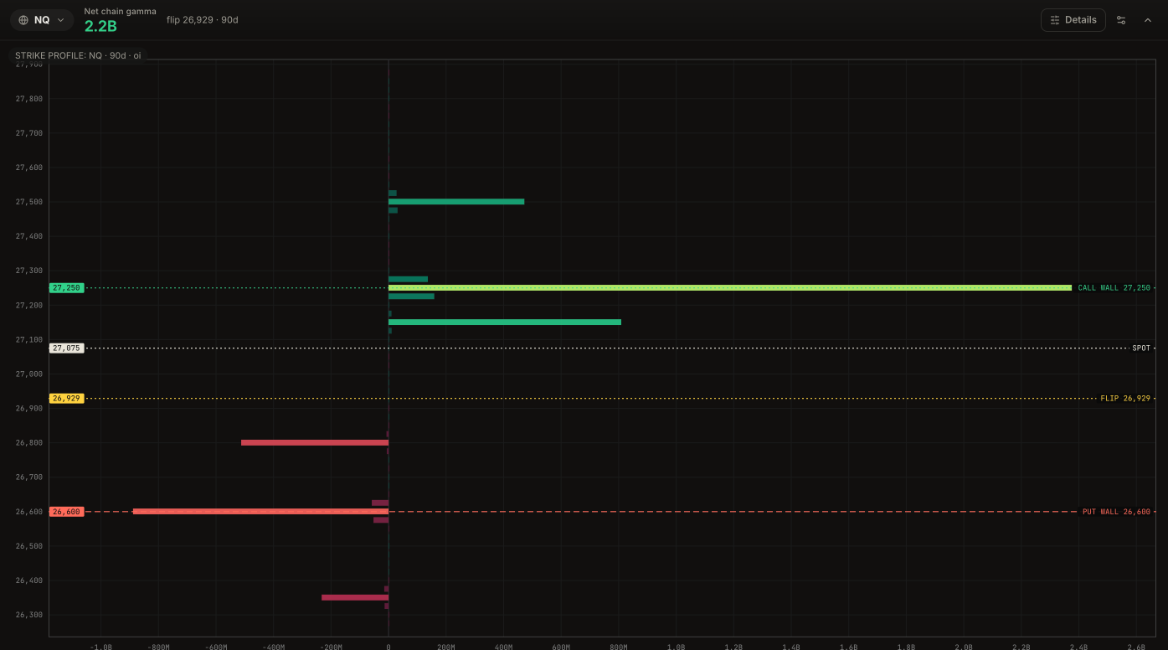
Reading it. Net chain gamma is +2.2B and the flip is at 26,929, about 150 points under spot. One bar dominates the chart: the call wall at 27,250, at about +2.4B, roughly three times the next largest strike (27,150, about +0.8B). Below price, the largest red bar is the put wall at 26,600, about -0.9B, with 26,800 (about -0.5B) closer to price.
What it means. The book is long gamma near price, and most of it sits at a single strike 175 points above. That strike is where dealer hedging is heaviest, so it is the most likely place for a rally to stall or for price to gravitate into an expiry.
How to use it.
- One dominant green strike above price: treat it as a target and a ceiling. Longs can aim for it; fresh longs right under it have little room.
- Spot between the flip and the big strike: dips toward the flip are more likely to be bought while the regime holds.
- A balanced profile with no standout bar: less pull toward any one price; rely on the flip and the walls instead.
- Compare the 0DTE and 1DTE windows in Details to see whether the short-dated book agrees with the 90-day picture.
Dealer exposure for any greek at every strike, colored by days to expiry, with the walls, flip and max pain.
Net dealer gamma at every strike, with the walls, flip, vol trigger and 1D range marked, and how to read it.
What dealer positioning is and why it moves price.