
04 / Widgets · Pressure Map
Pressure Map
A strike by expiry grid counting how many of the book's strongest readings point at each cell, to find where positioning concentrates.
Pressure Map asks one question of every expiry: which strikes stand out? For each expiry it looks for the strongest readings in the book (the largest exposure of each greek on either side, the most positive and most negative dealer gamma, the largest volatility greeks, and the heaviest call and put buying and selling) and adds one to the cell of the strike each points at. The first column, CHAIN, counts the strikes with the most open interest, volume and premium across all expiries. The brighter the cell, the more readings agree on it.
In Details choose the greeks (Core 4, Six or All 12), the weighting (OI, volume or both), the expiry type and range, how many strikes to show, and which groups of signals to count. Details also lists the busiest cells.
Practical application#
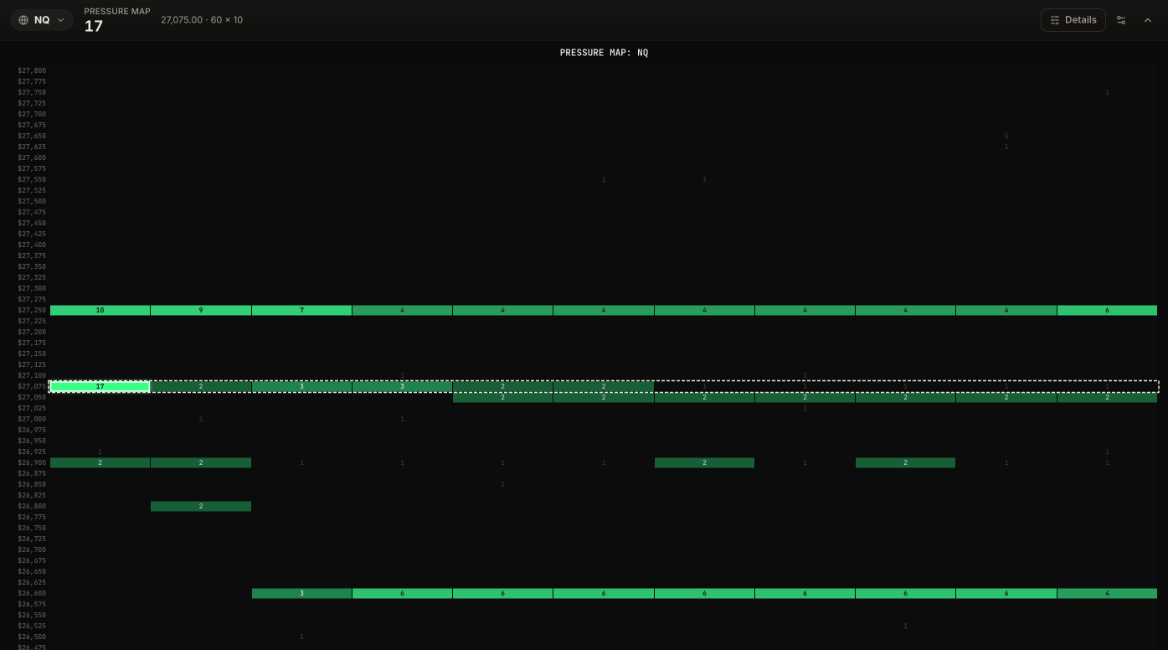
Reading it. One row runs across the whole map: 27,250, with 9 signals in today's expiry, 7 tomorrow and 4 to 6 in every later one. 26,600 is dark for the first two expiries, then lights up from four days out: 3 there, then 4 to 6 in each later expiry. The CHAIN column is brightest at 27,075 (17), the strike at the money, where today's volume and premium concentrate; 27,250 follows with 10.
What it means. 27,250 is the level the whole book agrees on, from today to three months out. 26,600 matters for next week's and later expiries but not for today's, so it is a level for swing trades more than for this session.
How to use it.
- A row lit across many expiries: a level that is likely to matter for days or weeks; plan around it.
- A cell lit only in the nearest expiry: a level for today; it fades once that expiry is gone.
- Turn signal groups off in Details to see what drives a cell: dealer exposure, volatility, or the day's buying and selling.
- Compare with Greek Heatmap to see the size behind each cell, not just how many readings point at it.
One greek's dealer exposure in a grid of strikes by expiries, so you can see which expiry holds the weight.
Open interest in a grid of strikes by expiries, to find where positions are concentrated.
Today's options contracts at each strike split into call buys, call sells, put buys and put sells, to see which side is aggressive where.