
04 / Widgets · Interval Map
Interval Map
How dealer exposure built up at each strike through the session, in time buckets, with price on top.
The Interval Map shows how exposure at each strike changed through the session. Each row is a strike and each mark a time bucket (3 minutes by default): green for positive net GEX, red for negative, larger and brighter for larger amounts. Price runs across as a white line. Yellow outlines mark the lead strike, the one with the most exposure in each stretch of time. The header gives the latest bucket's net GEX; overnight, a badge notes that only positioning is shown.
Marked (Beta) in the widget picker: it is newer, and some of the options data behind it can lag the live market by several minutes.
Practical application#
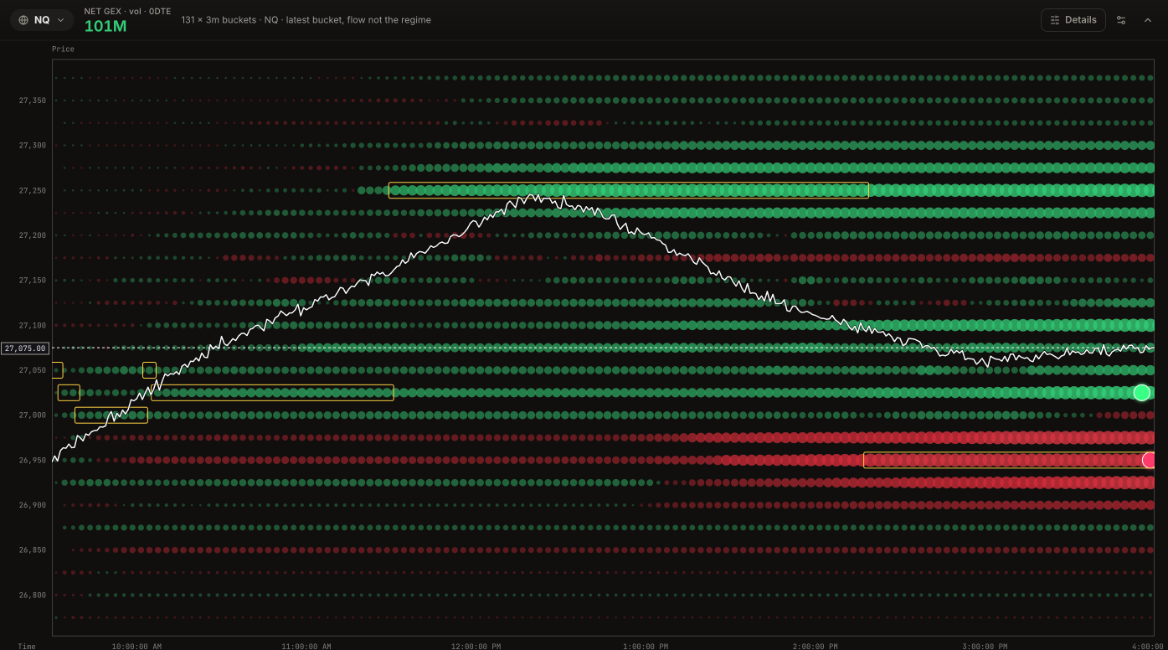
Reading it. In the morning the action follows price: the lead strike is 27,025 until 11:30 AM while NQ climbs from about 26,950. As the rally reaches the call wall, the lead moves to 27,250 and stays there from 11:30 AM to 2:18 PM, the biggest green row on the map. Price tops just under it around 12:20 PM. From 2:18 PM the lead jumps to 26,950, a red row below price that keeps growing into the close, while the green rows above fade in comparison.
What it means. Midday trading built positive exposure at the wall, which capped the rally. In the afternoon the weight shifted to negative exposure below price: the level where hedging adds to a move rather than slowing it.
How to use it.
- Follow the lead strike: it shows where the session's hedging weight sits right now, and when it moves.
- A growing green row just above price: expect rallies to slow there.
- A growing red row just below price: a break through it can speed up; tighten stops on longs.
- Switch Raw to Diff in Details to see only what changed each interval, which makes fresh positioning stand out.
Dealer gamma, charm or vanna by price and time, from the session so far projected forward to the close.
Gamma, delta, vanna, charm and convexity by strike, as ladders, profiles and heatmaps.
What updates live, what is set once a day, and why everything is in New York time.