
04 / Widgets · Volatility Cone
Volatility Cone
Realized volatility at each horizon against its historical range, with today's implied volatility on top.
The Volatility Cone shows how volatile the market has been at different horizons (from a few days to months) compared with its own history. The outer band is the sample's maximum and minimum, the inner band the 25th to 75th percentile, with the median in grey. The current realized volatility is the cyan line and ATM IV, what options price, is orange. Details sets the horizons and the history used (1 to 5 years), and lists each horizon's realized volatility.
Practical application#
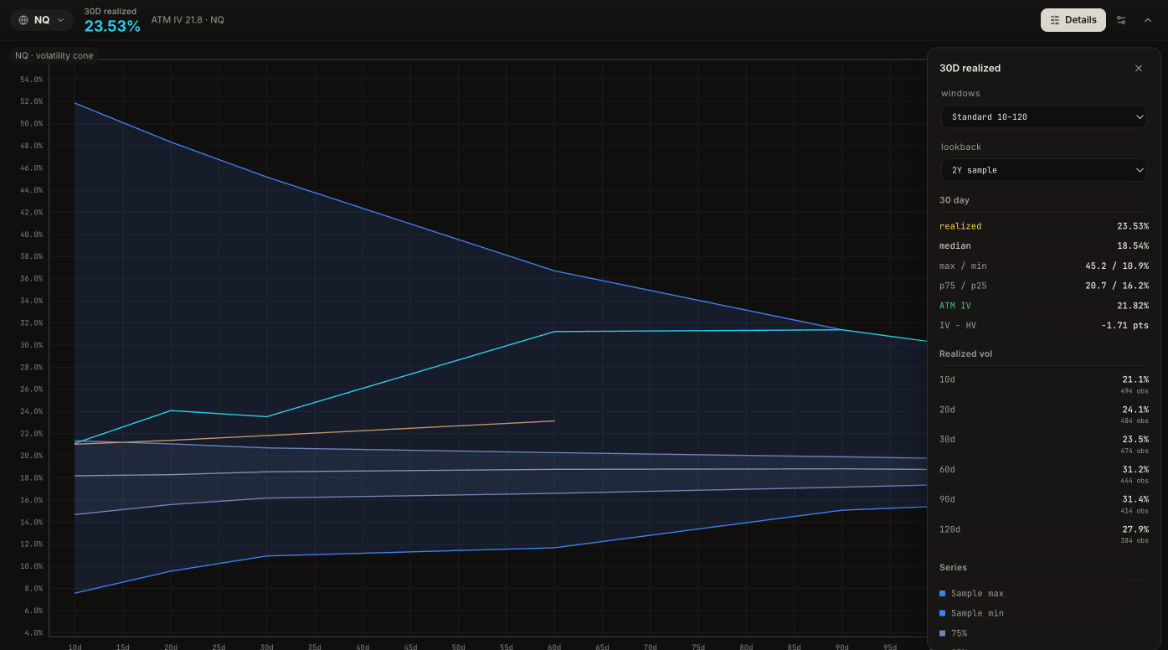
Reading it. Realized volatility is high at every horizon. At 30 days it is 23.53%, above the 75th percentile (20.7%) and well above the median (18.54%). The longer windows are higher still: 31.2% at 60 days and 31.4% at 90, close to the top of their range, because they still contain a volatile stretch from about two months ago. The shortest window, 10 days, has already dropped to 21.1%. Options price 21.82% at the money, 1.71 points below the 30-day realized.
What it means. The market is calming: recent moves are smaller than those of the past two to three months, but they are still larger than normal. Options are priced slightly below what the market has actually been doing.
How to use it.
- Current line near the top of the cone: moves are larger than usual; widen stops and size down.
- Short windows falling below longer ones: volatility is coming off its peak. Ranges tend to narrow from here.
- IV below realized (negative IV − HV): options are priced below recent movement. That is unusual, but realized volatility tends to settle after a volatile stretch, so it is not on its own a reason to buy options.
- IV above realized is the normal state: options usually price a little more movement than the market delivers. Only a wide gap marks them as expensive.