
04 / Widgets · Implied Distribution
Implied Distribution
The options-implied probability cone for price over the coming weeks, next to the recent candles.
Implied Distribution shows the range of prices the options market is pricing for the coming weeks. These are market-priced odds, not a forecast: they include what traders pay for protection, so they lean further toward falls than real-world outcomes usually do. Recent candles sit on the left of the TODAY line; on the right, a heat cone colors each price by how likely it is: the brighter the color, the more probable. The white line is the median, the dashed lines the 25 to 75% and 5 to 95% ranges, and the call and put walls are drawn across. The header gives the next session's one-standard-deviation range.
Choose the history window (Intraday, 2W, 1M, 2M, 3M), the candle size, the color scale and whether to show quantiles in the toolbar. Details lists, for each expiry, its one-standard-deviation range and the chance of finishing above the call wall or below the put wall.
Marked (Beta) in the widget picker: it is newer, and some of the options data behind it can lag the live market by several minutes.
Practical application#
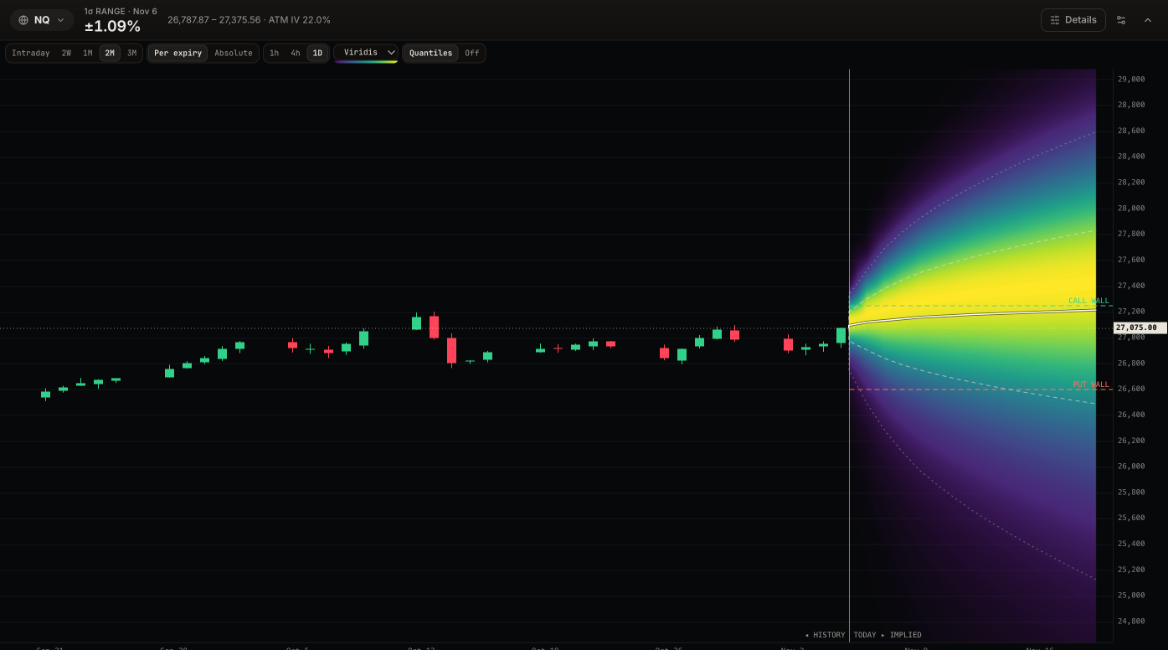
Reading it. After two months of candles holding between about 26,600 and 27,200, the cone opens from today's 27,075. For the next session the header gives a one-standard-deviation range of 26,787.87 to 27,375.56 (±1.09%). The cone is not symmetric: the median drifts up toward about 27,214 by Nov 19, while the dashed lines reach further down than up (about 25,126 at the 5% line against 28,595 at the 95% line, two weeks out). In Details, the chance of finishing above the 27,250 call wall rises from 32% tomorrow to 49% two weeks out; the chance of finishing below the 26,600 put wall rises from 8% to 28%.
What it means. Options price small gains as slightly more likely than small losses, but a larger move if price does fall: the usual shape for index options, where protection below the market is in demand.
How to use it.
- Set targets inside the bright band and treat the outer dashed lines as unlikely extremes for the horizon you trade.
- Use the probabilities in Details to judge a level: a 32% priced chance of closing above the call wall tomorrow says a breakout is possible, not likely. Read them as the market's pricing rather than exact odds.
- A longer tail below means stops under support should allow for a faster drop than the move up.
- Compare the 1σ range with Expected Move and with how far the session has already traveled.
The options-implied range around price for every horizon, with today's 1D band and how much of it is used.
The range options are pricing for the session, and how to use the 1σ band.
Term structure, smile, the surface, vol premium, implied distribution and the pricer.