
04 / Widgets · Chart Heatmap
Chart Heatmap
Dealer delta exposure in a grid of strikes by expiries: how large the hedge is at each strike, and which expiries carry it.
Chart Heatmap lays out dealer delta exposure as a grid: strikes down the side, expiries across the top, a value in every cell, with the largest cell lit up and the dashed row marking spot. Delta exposure is the size of the hedge behind each strike's options; Greek Heatmap shows gamma, how fast that hedge changes when price moves.
Practical application#
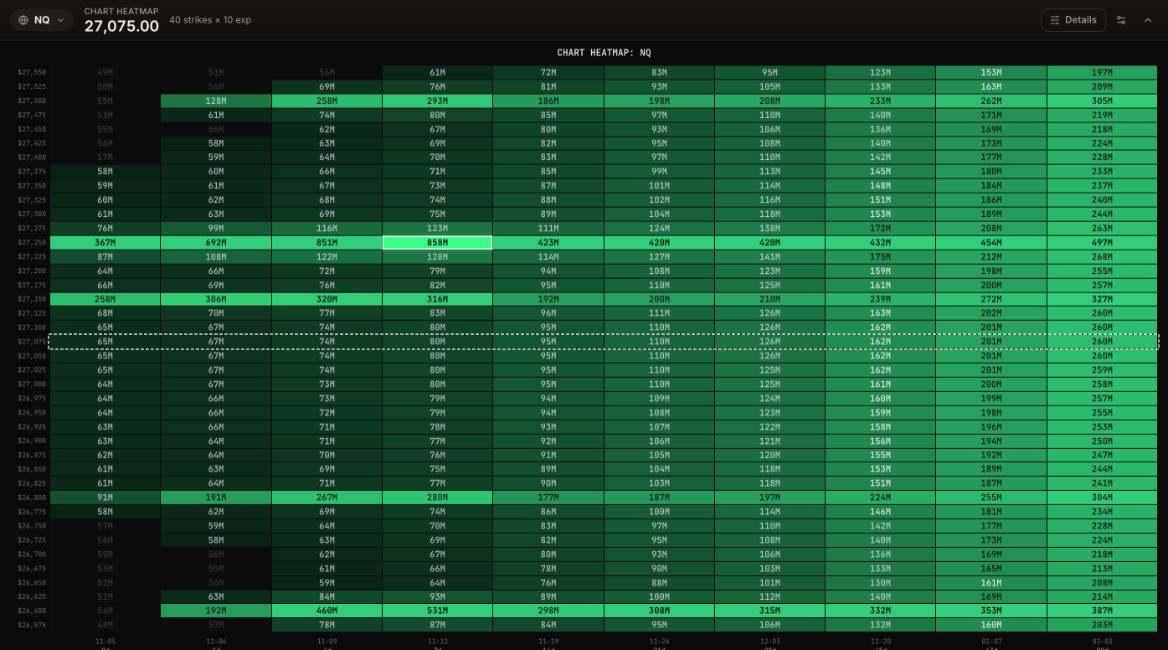
Reading it. The 27,250 row is the heaviest: 367M in today's expiry, 692M tomorrow, 851M four days out and 858M a week out, the largest cell on the grid. 26,600 follows the same pattern, from 192M tomorrow to 531M a week out. Away from those strikes, cells grow steadily from left to right: out-of-the-money options carry more delta the longer they have to expiry.
What it means. Compare it with the gamma grid for the same book: gamma at 27,250 is largest today, delta is largest next week. Today's options decide how fast hedges change as price moves; next week's options hold most of the hedge itself.
How to use it.
- The heaviest delta rows are where the largest hedges sit; a decisive break through one can force sizable hedge adjustments.
- Delta concentrated in near expiries comes off quickly as they expire; delta further out stays in place.
- Read it with Greek Heatmap: gamma tells you when hedging speeds up, delta how large the hedge is.
One greek's dealer exposure in a grid of strikes by expiries, so you can see which expiry holds the weight.
Open interest in a grid of strikes by expiries, to find where positions are concentrated.
Dealer exposure for any greek at every strike, colored by days to expiry, with the walls, flip and max pain.