
04 / Widgets · Greek Heatmap
Greek Heatmap
One greek's dealer exposure in a grid of strikes by expiries, so you can see which expiry holds the weight.
The Greek Heatmap lays out one greek's dealer exposure as a grid: strikes down the side, expiries across the top, a value in every cell. Red cells are negative, green positive, and the strongest cells are lit up. The dashed row marks spot. Choose the greek (gamma, delta, vanna, charm and more) and the weighting in the settings. Gamma Heatmap in the widget picker opens this same grid set to gamma.
Practical application#
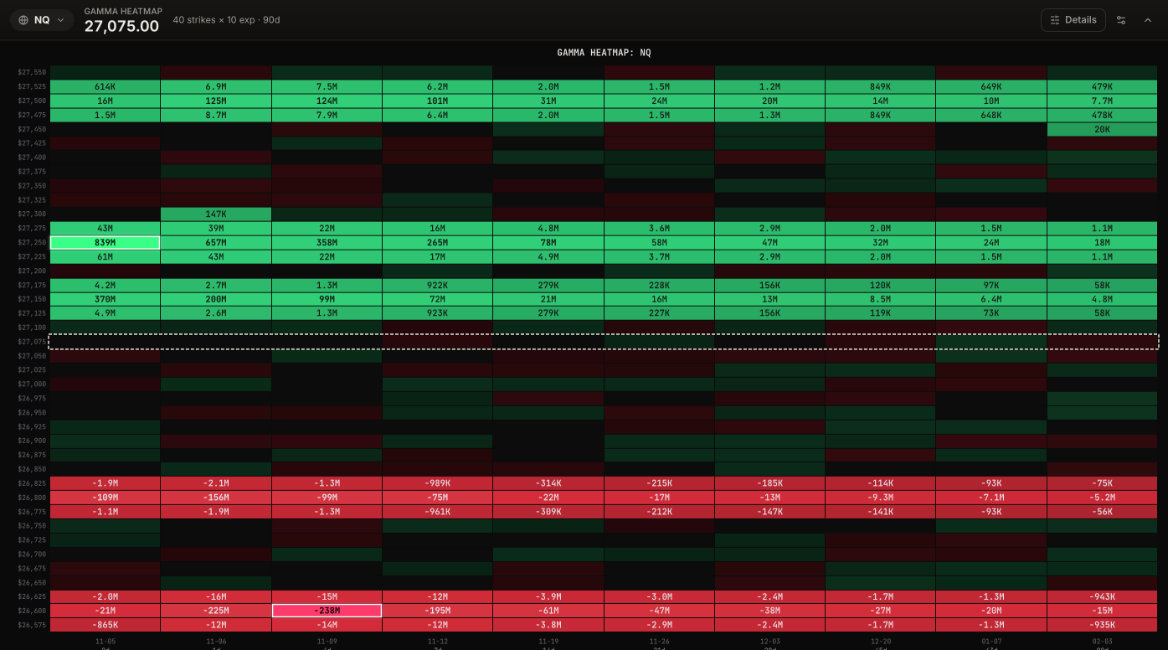
Reading it. Two rows carry most of the color. At 27,250 the brightest cell is the same-day expiry at +839M, then 657M the next day and 358M four days out; from a week out it is under 300M and keeps shrinking. At 26,600 the pattern is different: -21M today, but -225M tomorrow, -238M four days out (the strongest red cell) and -195M a week out. The dashed spot row at 27,075 sits between them, in mostly empty cells.
What it means. The 27,250 call wall is mostly made of options that expire today and tomorrow, so it is strong now and weakens quickly after that. The 26,600 put wall is built from next week's options, so it will still matter after the near expiries roll off.
How to use it.
- A wall concentrated in the first column: expect it to hold into today's close and to lose its grip once that expiry is gone.
- A wall spread across several expiries: a more durable level; plan swing trades around it.
- Empty cells around spot: little hedging pressure right at the price; moves between the walls can be quick.
- Switch the greek to charm to see how the exposure shifts as time passes, or vanna for how it shifts with volatility.
Open interest in a grid of strikes by expiries, to find where positions are concentrated.
Dealer exposure for any greek at every strike, colored by days to expiry, with the walls, flip and max pain.
Which expiries the levels cover, and why they move during the day.