
04 / Widgets · Exposure Flow
Exposure Flow
How much dealer gamma today's trading added above and below price, minute by minute, and which side is dominant.
Exposure Flow tracks the dealer gamma that today's options trading adds, split in two: calls at or above spot (blue) and puts at or below spot (red), with the price on the right axis. The header names the dominant side, whichever line is higher right now. Details sets the expiries (≤90DTE, 0DTE or 1DTE) and shows the latest value of each line.
Marked (Beta) in the widget picker: it is newer, and some of the options data behind it can lag the live market by several minutes.
Practical application#
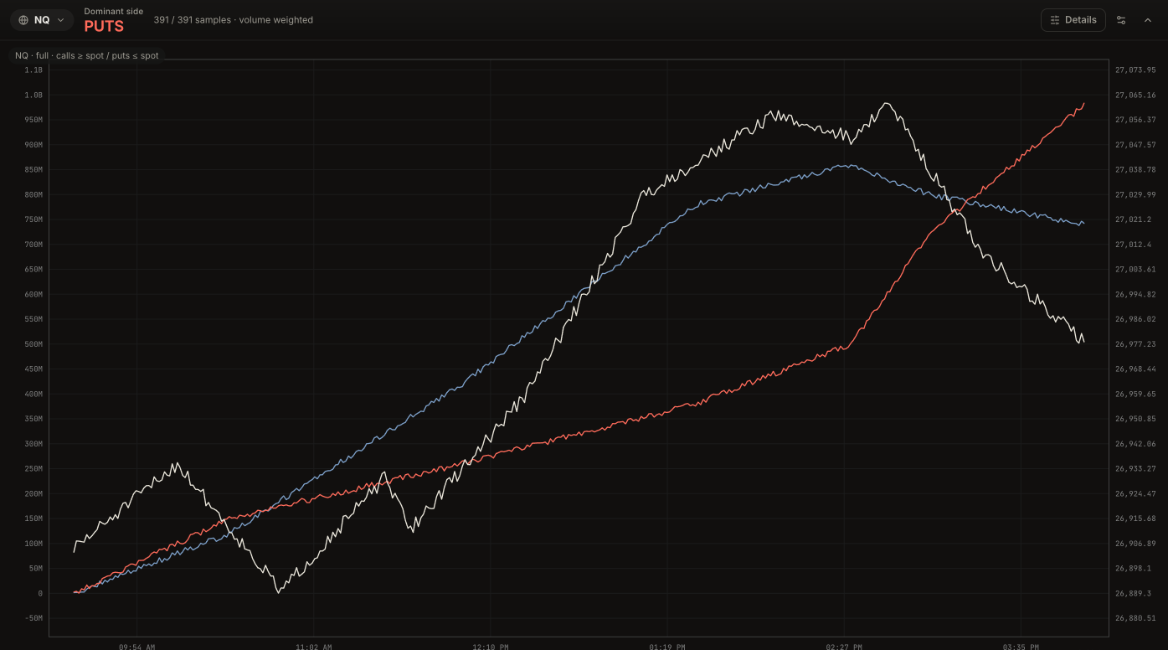
Reading it. Through the morning and the rally the call line leads, peaking around 860M near 2:30 PM while NQ climbs to about 27,060. The put line grows more slowly until about 2:30 PM, then turns sharply higher and crosses the call line near 2:50 PM, just as price starts to fall. By the close, puts at or below spot stand at 983M against 742M for calls, and the header reads PUTS.
What it means. For most of the day, trading was concentrated in calls above the market, which supported the rally. Late in the session the activity moved to puts below the market, and the move lost its support.
How to use it.
- Calls dominant during a rally: the move has support from above; buy pullbacks rather than fading it.
- Put line accelerating while price is still high: protection is being bought; tighten stops on longs.
- A crossover from CALLS to PUTS (or back): a shift in where the day's activity is. Treat it as a warning, and confirm with price.
- Switch to 0DTE to see the same-day options, which react most to price.
Running options delta, gamma, vanna and charm flow for the session, drawn over price, so you can see when flow leads or leaves a move.
Cumulative call and put premium through the session, the net between them, and the underlying, so you can see which side is leaning.
Where today's options trading landed, strike by strike, as gamma, delta, vanna or charm flow, or as call and put volume.