
04 / Widgets · Flow
Flow
Running options delta, gamma, vanna and charm flow for the session, drawn over price, so you can see when flow leads or leaves a move.
Flow draws the session's options flow as running totals on the same time axis as price. The default line is Aggregate DEX: the net delta of the day's options trades, split into calls and puts. When it climbs, the options market is adding upside exposure; when it falls, it is taking it off or adding downside.
What it shows#
| Element | What it is |
|---|---|
| aggregate dex (white) | Calls plus puts: the session's net delta flow |
| agg call dex (blue) | The call side alone |
| agg put dex (red) | The put side alone |
| Price | Candles or a line, on the right axis |
Details switches the metric (Net GEX, Net Convexity, Net Vanna, Net Charm, or bar versions that show each interval's change), the expiry scope, the time window (15 minutes to the whole session), the candle size, and an optional line for the next expiry.
Marked (Beta) in the widget picker: it is newer, and some of the options data behind it can lag the live market by several minutes.
Practical application#
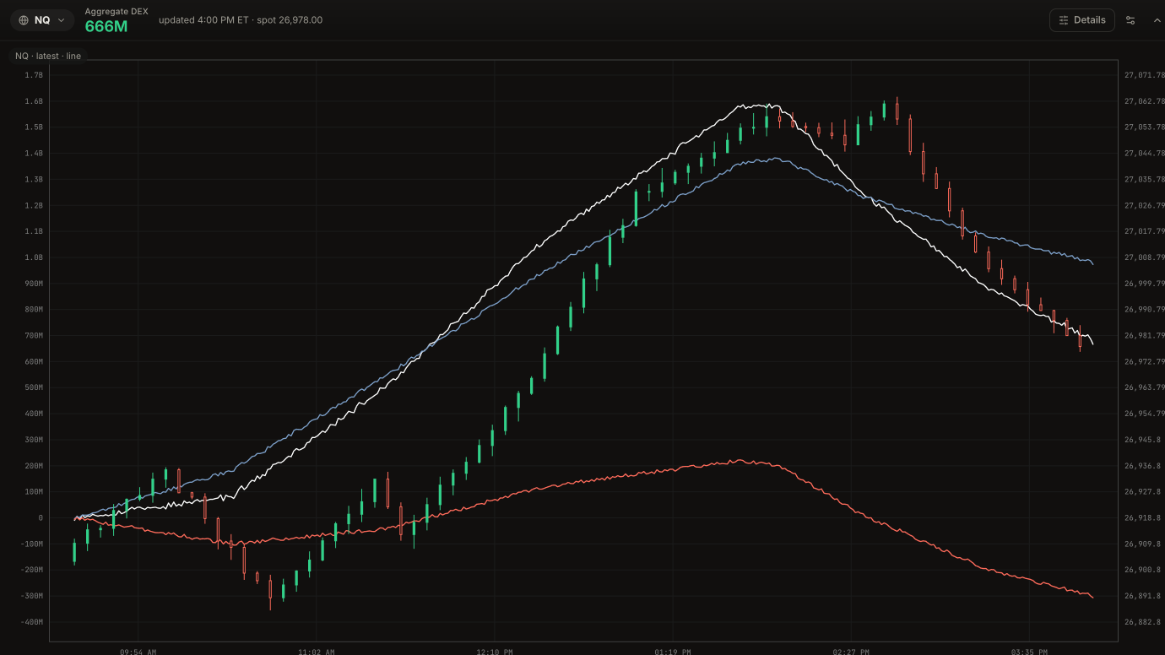
Reading it. In this example price spends the morning in a range between about 26,890 and 26,940. Aggregate DEX does not: from 10:00 it climbs steadily while price is still stuck. Price breaks out of the range after 11:30 and runs to about 27,060. Aggregate DEX tops near $1.6B around 1:50 PM and turns down. Price makes one more high near 2:40 PM without it, then falls to 26,978 by the close while the put side drops to -$307M.
What it means. Flow led price twice: it built before the breakout, and it left before the top. The second high had no new delta behind it.
How to use it.
- Flow rising while price is still in a range: pressure is building on the upside. Watch for the range to break in that direction.
- Flow and price rising together: the move has support; buy pullbacks rather than fading it.
- Price makes a new high but flow does not: the move is running on less behind it. Tighten stops or take profits.
- The put line turning hard lower: downside exposure is being added; combine it with Key Levels to find where the drop may stop.
Set window to *all* to read the whole session, as in the picture. Flow is not available in Replay.