
04 / Widgets · Greek Exposure
Greek Exposure
Dealer exposure for any greek at every strike, colored by days to expiry, with the walls, flip and max pain.
Greek Exposure shows dealer exposure for one greek at a time (gamma, delta, vanna, charm, vega and more) at every strike, with each bar split by color into the expiries it comes from. The header gives the net exposure for the chosen greek. The call walls and put walls are marked in order of size (wall, A, AA), with the flip between them. Choose the greek, the weighting and the expiry window in Details.
Practical application#
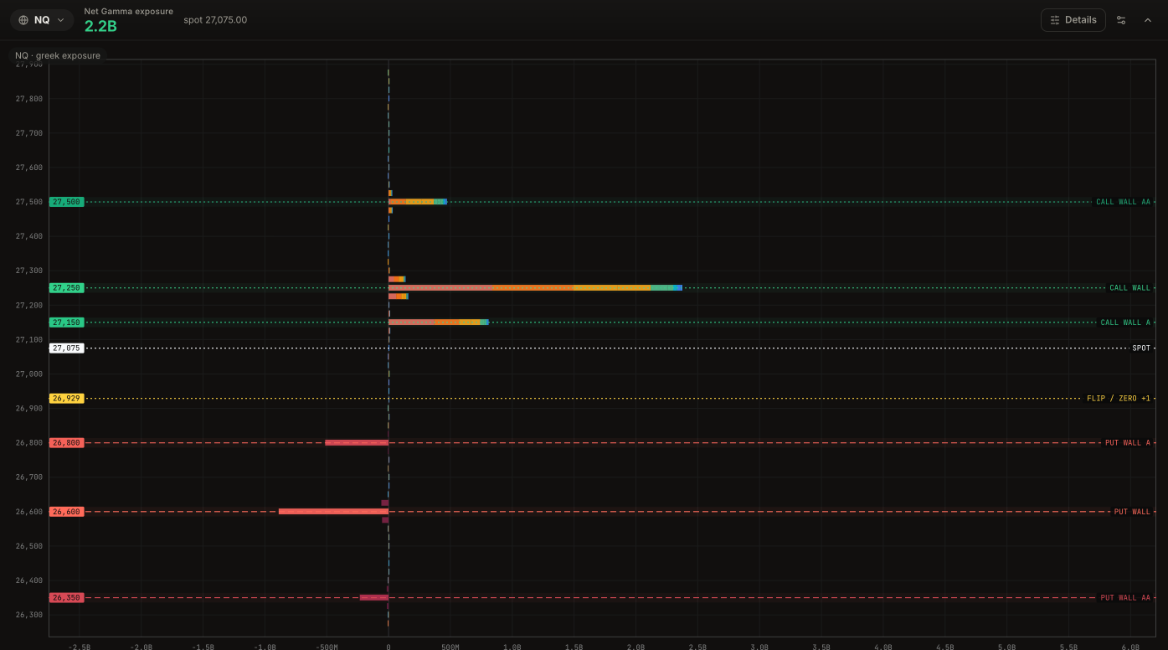
Reading it. Net gamma exposure is +2.2B and spot, at 27,075, sits about 150 points above the flip at 26,929: dealers are long gamma. The biggest bar on the chart is the call wall at 27,250, about +2.4B on its own, with smaller call walls at 27,150 (+0.8B) and 27,500 (+0.5B). Below price, the put walls are at 26,800 (-0.5B), 26,600 (the largest, about -0.9B) and 26,350.
What it means. Price is boxed in by the two closest walls. Above, 27,150 and 27,250 stack up within 175 points of spot; below, the flip and the 26,800 put wall come first. Long gamma around price favors a range between them.
How to use it.
- Spot between the flip and a large call wall: expect rallies to slow into 27,150 to 27,250. Fade the first test rather than chase it.
- Watch the flip, not just the walls: a drop under 26,929 changes the regime, and the 26,800 and 26,600 put walls are the next stops.
- The colors show which expiries make a wall. A wall built mostly from the nearest expiry fades after that expiry; one spread across many expiries lasts.
- Switch the greek to charm or vanna to see whether time decay or a change in volatility will add to, or ease, that pressure.
Bars fill the share of the chart set by width % under Profile in the widget settings (43% by default); the axis stretches with it, so each bar still ends at its own value. Hover a bar for the exact figure.
Net gamma of the whole chain at each strike, as one profile, with the flip, call wall and put wall.
What dealer positioning is and why it moves price.
Gamma, delta, vanna, charm and convexity by strike, as ladders, profiles and heatmaps.