
04 / Widgets · Candles
Candles
Candlesticks with the walls, gamma flip, vol trigger and 1σ band drawn on price, and how to trade them.
The Candles widget is a candlestick chart of the selected symbol with the q-bitf levels drawn straight on price: call wall, put wall, gamma flip, vol trigger and the 1σ expected-move band. It is the quickest way to see how price is behaving around the levels, and it is one of the widgets that can rewind in Replay.
What it shows#
| On the chart | What it is |
|---|---|
| Call Wall (green) | The heaviest call positioning above price. See Call wall and put wall |
| Put Wall (red) | The heaviest put positioning below price |
| Gamma Flip (yellow, dashed) | Where dealer gamma turns from positive to negative. See Gamma flip |
| Vol Trigger (purple, dashed) | The HVL: the same turning point across the whole book |
| +1σ / −1σ (grey, dashed) | The expected move for the rest of the day |
| Price tag (right edge) | The last price |
| Volume bars | Traded volume per candle |
Pick 1m, 5m, 15m or 1h candles in the top-right corner. The lines show each level's value at the time you are looking at, so in Replay they move as the session plays.
Practical application#
The three examples below are real NQ sessions from the q-bitf Replay history. The screenshots are the Candles widget exactly as it looked at the time named in each caption.
1. A call wall holds in positive gamma (NQ, Oct 6, 2026)#
NQ opened at 31,513.50 in a STRONG POSITIVE gamma regime, with the call wall at 31,612.84 and the gamma flip below price. Price rallied into the wall and peaked at 31,616.75 around 11:15 ET, less than four points above it. It could not hold there: by 3:00 PM it had sold back to 31,533, right on the gamma flip at 31,527.07, and it closed at 31,480.50.
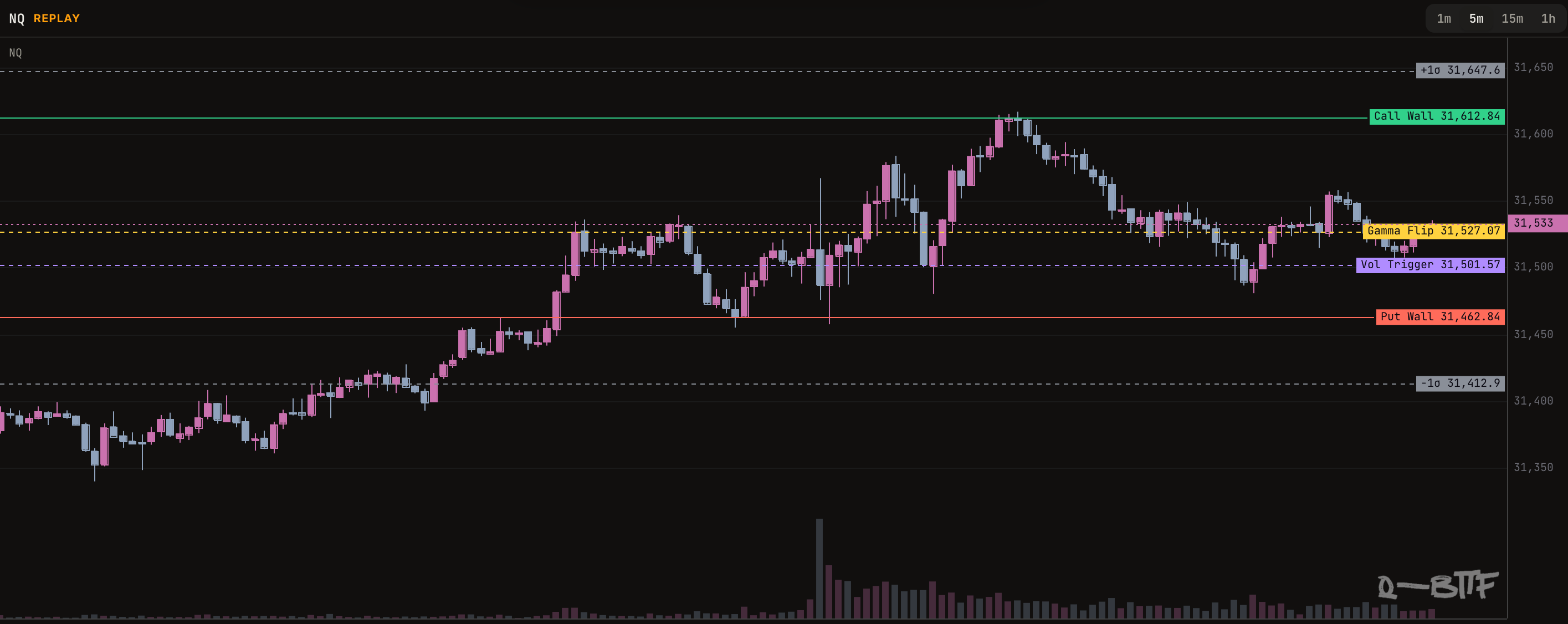
How to use it. In positive gamma, dealer hedging sells rallies into the call wall. A first touch of a STRONG wall is a fade candidate, with a stop a little above the wall and the gamma flip as the first target. A close above the wall would cancel the idea.
2. Price breaks the gamma flip (NQ, Sep 23, 2026)#
NQ opened at 31,005.75, above a gamma flip near 30,815, in STRONG POSITIVE gamma. Price slid through the flip at 10:07 ET, and the regime reading turned STRONG NEGATIVE the same minute. It fell to 30,642.25 by 10:26, through the bottom of the 1D range at 30,796.37. At 11:01 it rallied back to 30,827.75, three points above the flip, and rolled over again. It closed at 30,770.25, still below the flip.
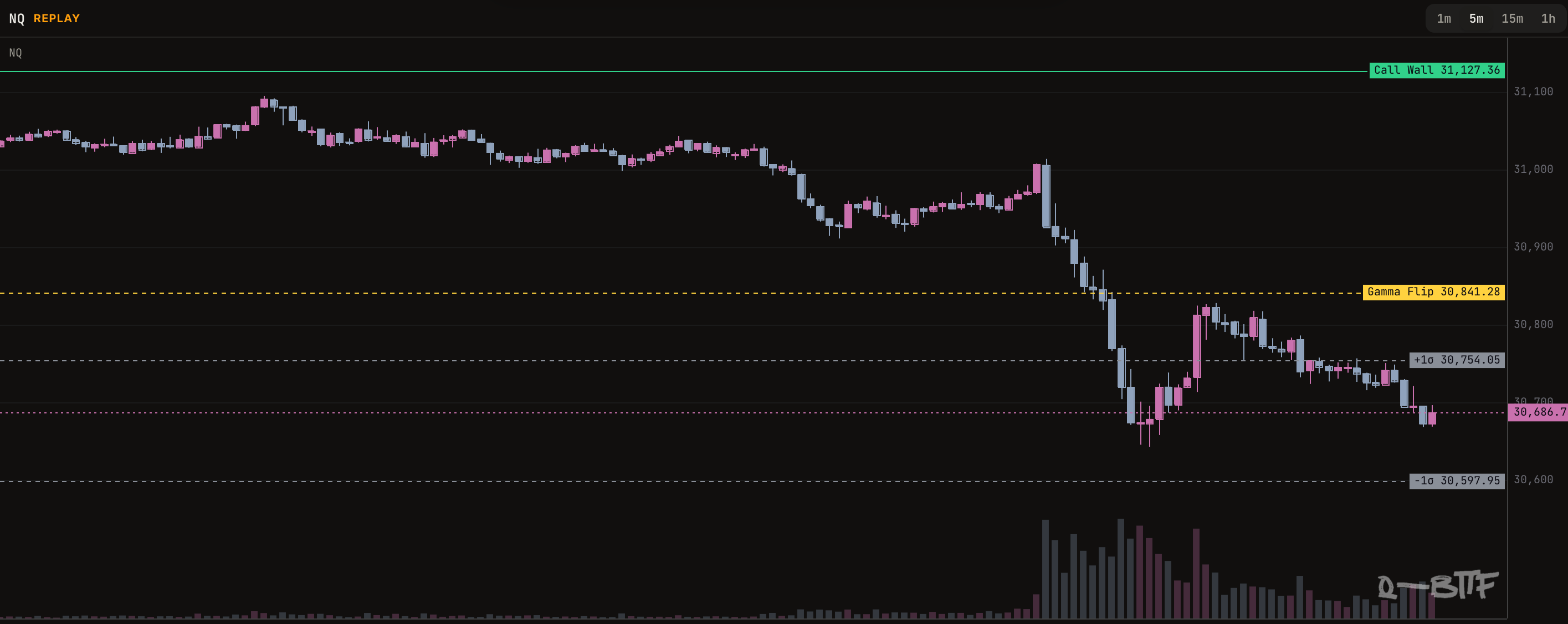
How to use it. A break below the flip means dealers have switched from damping moves to chasing them, so expect a wider range and stop fading. The first retest of the flip from below is a common place for the move to resume, as it did here at 11:01.
3. Walls break in negative gamma (NQ, Oct 16, 2026)#
NQ opened at 30,024 already below the gamma flip, in STRONG NEGATIVE gamma. The put wall at 29,910 gave way at about 9:55 ET. A bounce at 10:48 reached 29,931.75, just above the broken wall, and failed. As price fell, the put wall kept moving lower with it: by noon it sat at 29,708.60 with price below it at 29,659, and the gamma flip had dropped to 29,936.06. The session closed near 29,400 after a 2.5% range.
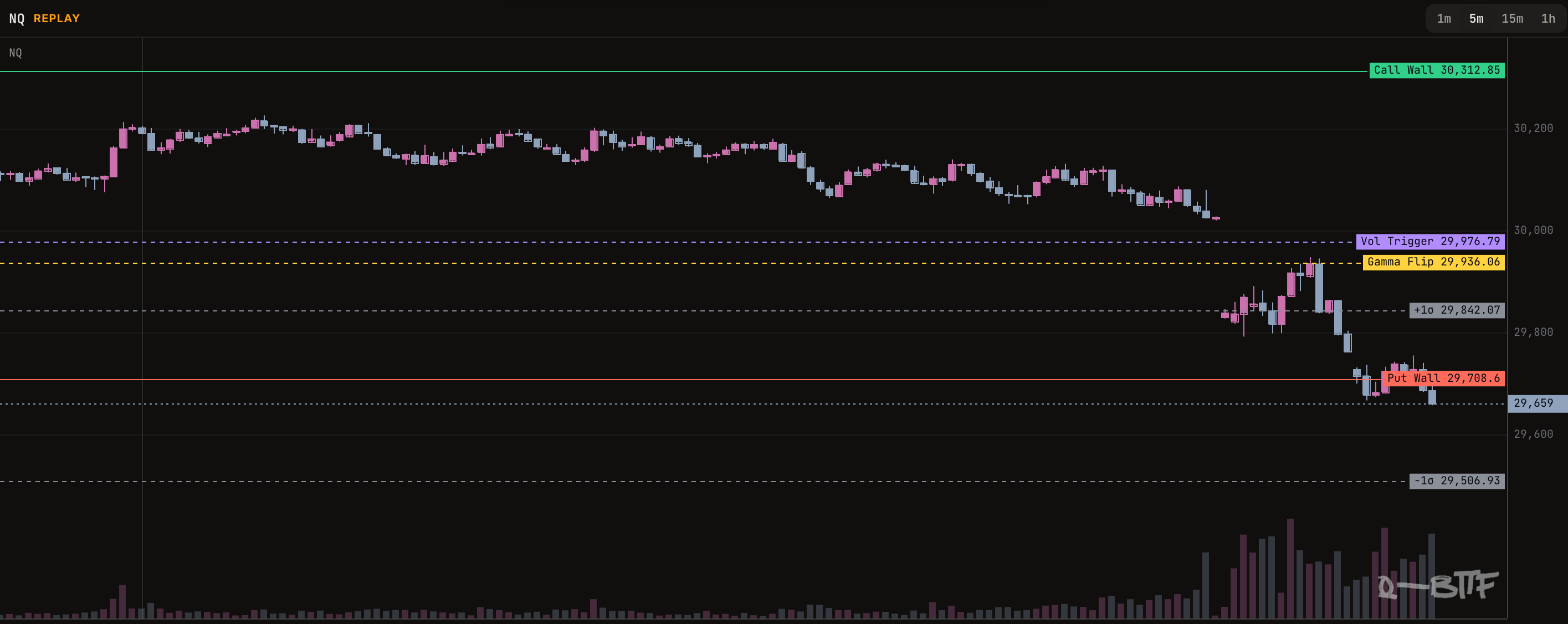
How to use it. In negative gamma, support walls tend to break and then move with price instead of holding. A wall that keeps stepping lower is not support. Treat failed bounces into a broken wall, like the one at 10:48, as signs the move is still on.
Rewind a past session#
Click Replay in the workspace toolbar, pick a day and a time (Cash open, Midday, Close and others), then press play. Candles, Key Levels, GEX Levels, Session Price and the Regime Strip rewind together. GEX Levels shows the day-trade ladder that was stored for that session. Replay covers ES, NQ and GC.
Questions#
What lines does the Candles widget draw?#
The call wall, put wall, gamma flip, vol trigger (HVL) and the ±1σ expected-move band, each at its value for the time shown.
Can I see past sessions in the Candles widget?#
Yes. Use Replay in the workspace toolbar to pick a past ES, NQ or GC session and play it back bar by bar with the levels as they were.
What call and put walls are, why price stalls at them, and when they break.
The price where dealer gamma turns from positive to negative, and why it matters.
What positive and negative gamma mean for price, and how to read the regime badge.