
04 / Widgets · IV Term Structure
IV Term Structure
At-the-money implied volatility for every expiry, with the 30-day VIX window marked.
IV Term Structure plots at-the-money implied volatility for every listed expiry, front to back. The header shows the front expiry's IV and how many expiries are plotted; the VIX window marks the 30-day stretch the VIX measures. Details lists every expiry's IV and the slope from front to back, labeled backwardation when the front is higher.
Marked (Beta) in the widget picker: it is newer, and some of the options data behind it can lag the live market by several minutes.
Practical application#
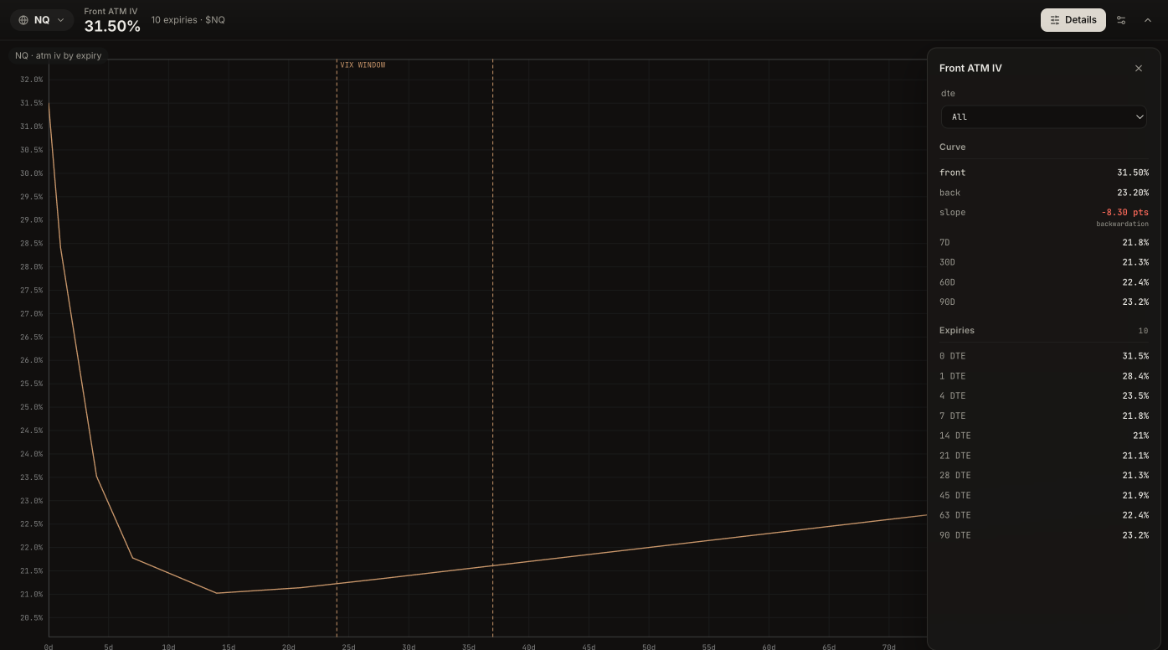
Reading it. The same-day expiry is priced at 31.50% and the next day's at 28.4%, while everything from one week out sits between 21% and 23%. The slope from front to back is -8.30 points, so Details labels it backwardation. The curve bottoms near 21% at 14 days and climbs slowly to 23.2% at 90.
What it means. Only the next few days carry extra premium: the market is pricing a specific near-term event, not a lasting rise in volatility. Once the event passes, the front of the curve usually drops back toward 21 to 22%.
How to use it.
- Steep backwardation in the first few days: expect bigger moves around the event, and expect same-day options to lose their premium quickly after it.
- Front well below the back (contango): a calm market; ranges and fades tend to work better.
- Where the curve bottoms shows how long the market expects the event to matter. Here, about a week.
- Compare it with IV Smile to see whether that premium is in the puts, the calls or both.
Implied volatility across strikes for one expiry, with calls, puts, a fitted curve and the 25-delta strikes.
Realized volatility at each horizon against its historical range, with today's implied volatility on top.
Term structure, smile, the surface, vol premium, implied distribution and the pricer.