
04 / Widgets · IV Smile
IV Smile
Implied volatility across strikes for one expiry, with calls, puts, a fitted curve and the 25-delta strikes.
IV Smile plots implied volatility across strikes for one expiry, as a smooth Fitted curve or the Raw quotes. Dashed markers show spot and the two 25-delta strikes, and a dotted line marks at-the-money IV. The header gives the 25Δ risk reversal: call IV minus put IV at the 25-delta strikes, in volatility points. Details adds the 25-delta put and call IV, the butterfly, and every expiry's at-the-money IV.
Marked (Beta) in the widget picker: it is newer, and some of the options data behind it can lag the live market by several minutes.
Practical application#
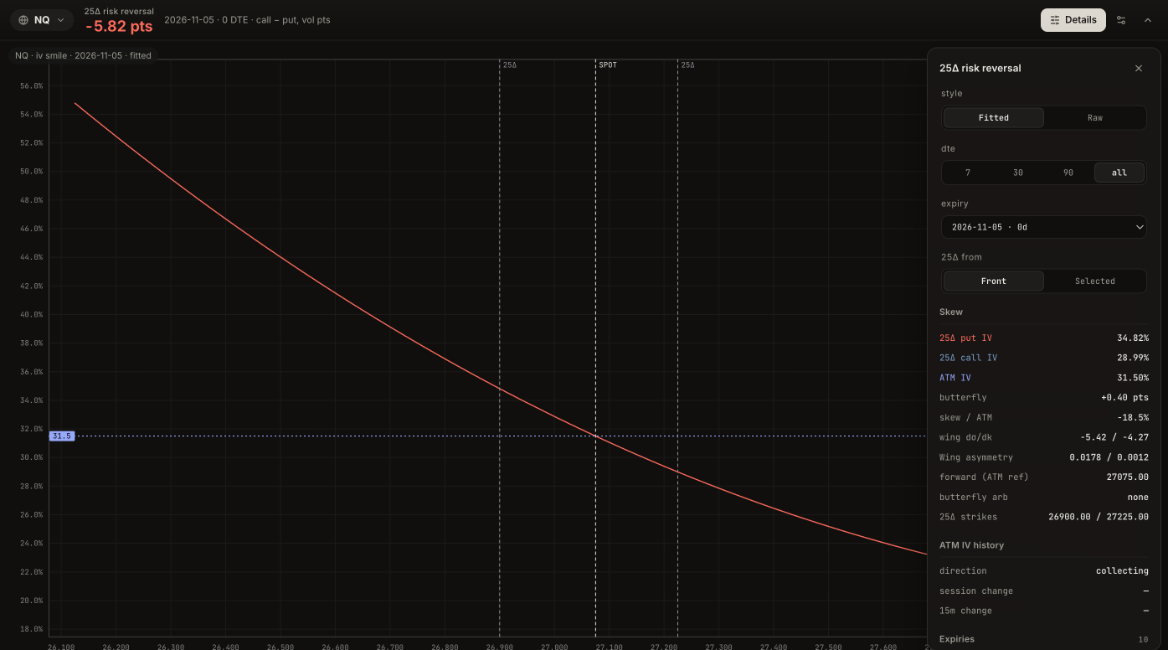
Reading it. On the same-day expiry the 25-delta put, at 26,900, is priced at 34.82% and the 25-delta call, at 27,225, at 28.99%: a risk reversal of -5.82 points. The curve falls steadily from left to right: about 55% at 26,100 down to about 23% at 27,600. The butterfly is only +0.40 points, so the two wings are not both bid; the extra premium is on the downside.
What it means. Traders are paying up for protection below the market far more than for upside. Combined with the inverted term structure, the market is braced for a drop around a near-term event.
How to use it.
- A deeply negative risk reversal: downside protection is expensive. Selling rallies into resistance tends to work better than buying dips aggressively.
- Risk reversal moving back toward zero: fear is easing; dips are more likely to be bought.
- A positive risk reversal (calls above puts) is rare in index futures; it signals a chase for upside.
- Pick another expiry in Details to see whether the skew is a same-day effect or runs across the curve.