
04 / Widgets · Strike Map
Strike Map
Open interest in a grid of strikes by expiries, to find where positions are concentrated.
The Strike Map shows open interest as a grid: strikes down the side, expiries across the top, with brighter green for more open contracts. The largest cell is lit up and the dashed row marks spot. It answers a simple question: where are the positions?
Practical application#
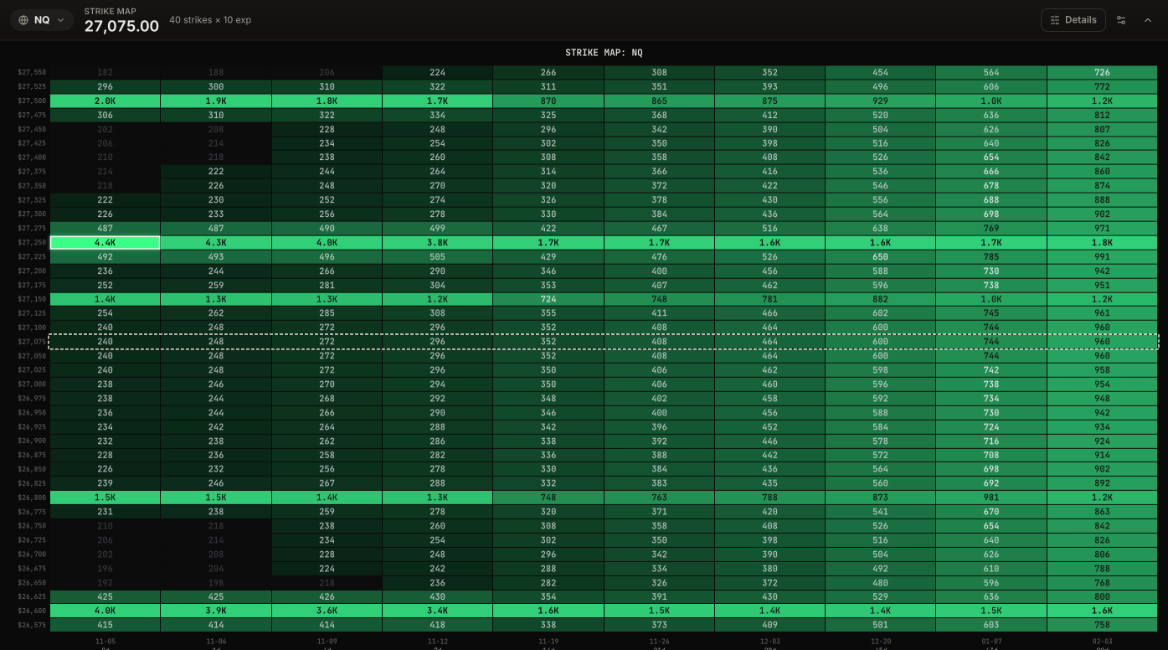
Reading it. Two rows stand out from top to bottom. 27,250 holds the largest cell, 4.4K contracts in today's expiry, and stays between 3.8K and 4.3K in every expiry through a week out. 26,600 is almost as heavy, 3.4K to 4.0K over the same expiries. Lighter rows sit at 27,500, 27,150 and 26,800. From two weeks out, the grid evens out at a few hundred to about 1.8K per cell.
What it means. The positions are concentrated at two strikes and spread evenly over the next four expiries. Compare this with Greek Heatmap: the same open interest produces far more gamma in today's expiry than in next week's, because near-the-money options closest to expiry react most to price.
How to use it.
- The brightest rows are the strikes to watch: that is where positions are, and where hedging and closing activity will happen.
- Open interest stacked across several expiries makes a level matter for longer than one heavy cell in a single expiry.
- Check the far columns: a strike that stays bright two or three months out is a longer-term level, not just this week's.
- Pair it with Open Interest to see what changed since yesterday.
One greek's dealer exposure in a grid of strikes by expiries, so you can see which expiry holds the weight.
Call and put open interest at every strike, the put/call ratio near spot, max pain and the key levels.
The strike where expiring options pay out the least, and how much weight to give it.