
04 / Widgets · Surface
Surface
Implied volatility across every strike and expiry as one 3D surface, so skew and term structure can be read together.
Surface draws implied volatility for every strike (one axis) and every day to expiry (the other) as a single 3D surface, colored from low to high IV. It combines what IV Smile shows for one expiry and what IV Term Structure shows at the money. Drag to rotate, scroll to zoom, and use the toolbar to reset the view. Details can switch the surface to open interest or volume instead of IV.
Marked (Beta) in the widget picker: it is newer, and some of the options data behind it can lag the live market by several minutes.
Practical application#
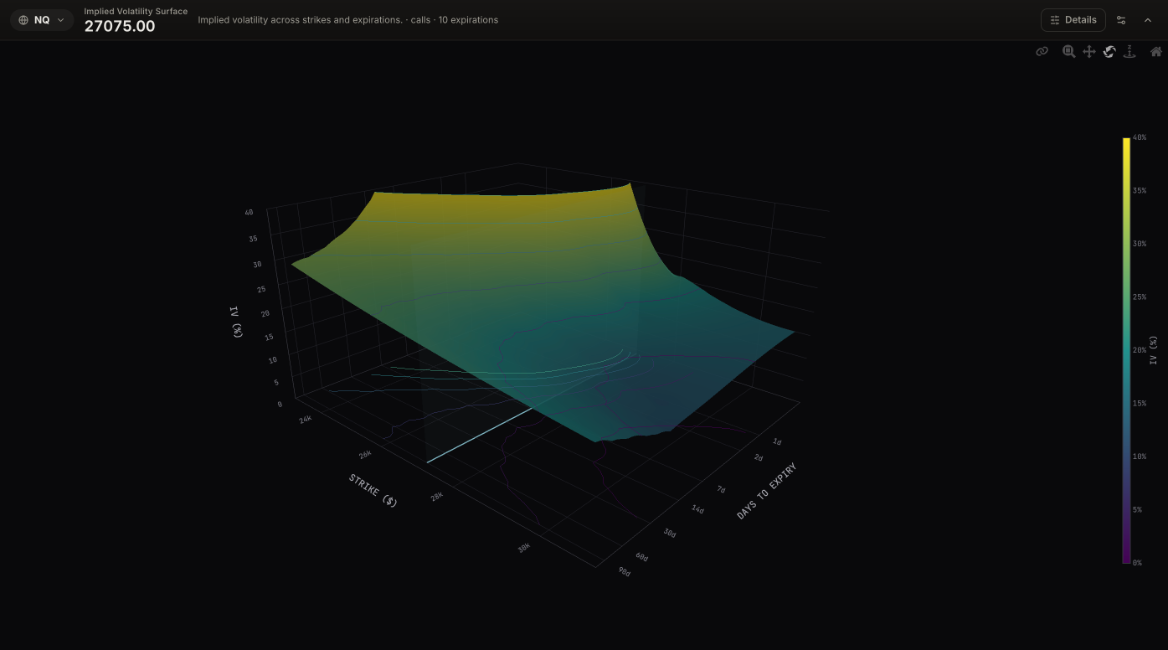
Reading it. Two shapes stand out. Along the days-to-expiry axis, the front edge is lifted: the shortest expiries sit around 30% and higher, then the surface drops quickly and flattens near 21 to 23% from about two weeks out. Along the strike axis, the surface tilts up toward lower strikes at every expiry, steepest in the front.
What it means. This is the same market as the term-structure and smile examples, seen at once: a near-term event priced into the first few expiries, and demand for downside protection that is strongest close in.
How to use it.
- A raised front edge: short-dated options are expensive. Expect bigger moves around the event, and a quick drop in that premium after it.
- A tilt toward low strikes: puts carry the premium; the market fears a drop more than it chases a rally.
- A flat surface: a calm market, with little event or crash premium.
- Rotate the surface to look straight down the strike axis for the term structure, or down the expiry axis for the skew.
Implied volatility across strikes for one expiry, with calls, puts, a fitted curve and the 25-delta strikes.
At-the-money implied volatility for every expiry, with the 30-day VIX window marked.
Realized volatility at each horizon against its historical range, with today's implied volatility on top.